Technical Analysis of IQ 2024-05-10
Overview:
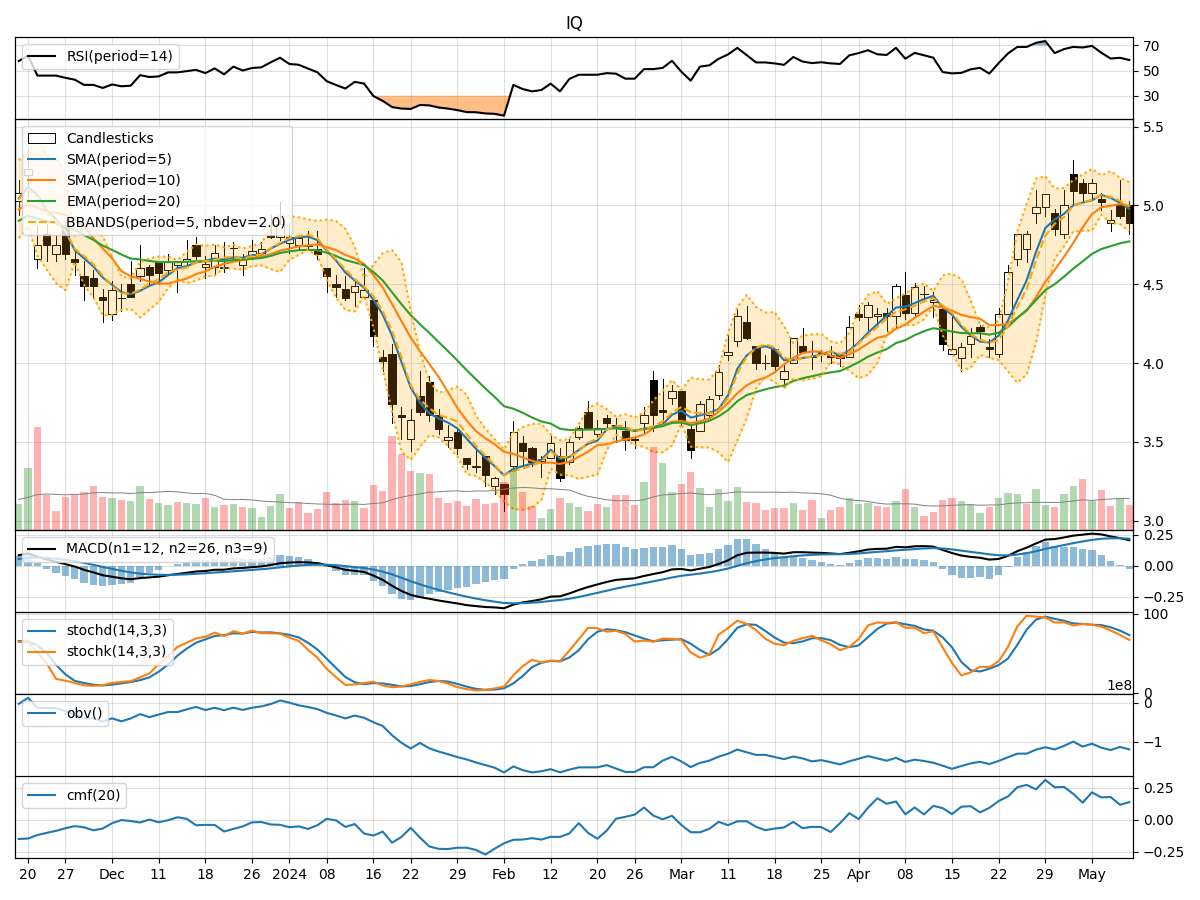
In analyzing the technical indicators for IQ stock over the last 5 days, we will delve into the trend, momentum, volatility, and volume indicators to provide a comprehensive outlook on the possible stock price movement in the coming days.
Trend Analysis:
- Moving Averages (MA): The 5-day Moving Average (MA) has been fluctuating around the current price, indicating a lack of clear trend direction.
- MACD: The Moving Average Convergence Divergence (MACD) has been positive but showing signs of weakening over the past few days.
- EMA: The Exponential Moving Average (EMA) has been gradually increasing, suggesting a potential bullish sentiment in the short term.
Momentum Analysis:
- RSI: The Relative Strength Index (RSI) has been oscillating around the neutral level of 50, indicating a balanced momentum between buying and selling pressure.
- Stochastic Oscillator: Both %K and %D have been declining, signaling a potential bearish momentum in the stock.
- Williams %R: The Williams %R is in oversold territory, suggesting a possible reversal in the near future.
Volatility Analysis:
- Bollinger Bands (BB): The Bollinger Bands have been narrowing, indicating decreasing volatility in the stock price.
- BB%: The %B indicator has been hovering around the middle band, suggesting a period of consolidation.
Volume Analysis:
- On-Balance Volume (OBV): The OBV indicator has been relatively stable, indicating a balance between buying and selling volume.
- Chaikin Money Flow (CMF): The CMF has been positive but trending downwards, signaling a potential decrease in buying pressure.
Key Observations:
- The trend indicators show mixed signals with a slight bullish bias in the short term.
- Momentum indicators suggest a weakening bullish momentum and a possible shift towards bearish sentiment.
- Volatility indicators point towards a period of consolidation and reduced price fluctuations.
- Volume indicators indicate a balanced volume between buyers and sellers.
Conclusion:
Based on the analysis of the technical indicators, the next few days for IQ stock may see sideways movement with a slight bearish bias. Traders should exercise caution and closely monitor key support and resistance levels for potential entry or exit points. It is advisable to wait for more confirmation from the indicators before taking significant trading positions.