Technical Analysis of IRBT 2024-05-31
Overview:
In analyzing the technical indicators for IRBT over the last 5 days, we will delve into the trend, momentum, volatility, and volume indicators to provide a comprehensive outlook on the possible stock price movement. By examining these key aspects, we aim to offer valuable insights and predictions for the upcoming days.
Trend Analysis:
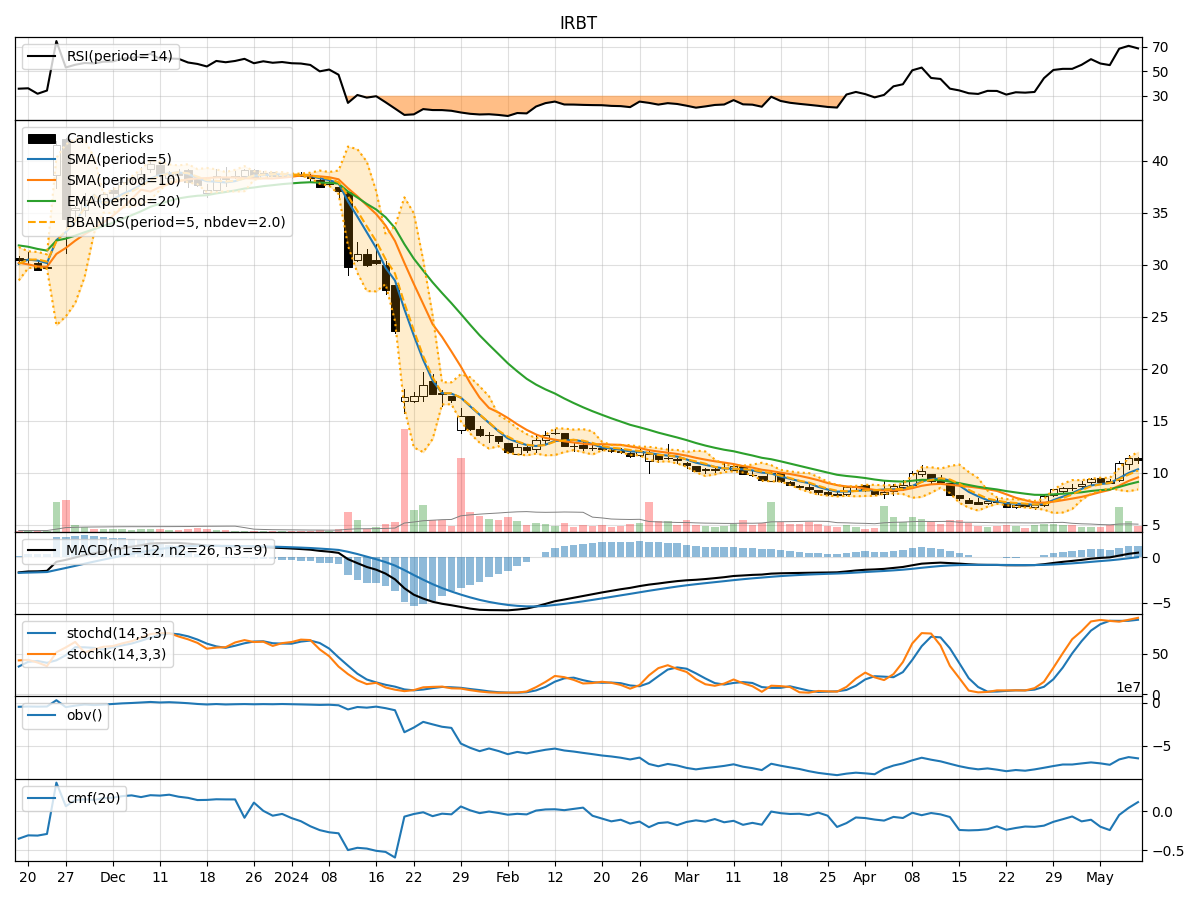
- Moving Averages (MA): The 5-day moving average has been consistently below the longer-term moving averages (SMA and EMA), indicating a downward trend in the stock price.
- MACD: The MACD line has been above the signal line, suggesting a potential bullish momentum in the short term.
- MACD Histogram: The MACD histogram has been decreasing, indicating a weakening bullish momentum.
Momentum Analysis:
- RSI: The RSI has been hovering around the neutral zone, indicating a lack of strong buying or selling pressure.
- Stochastic Oscillator: Both %K and %D have been in oversold territory, suggesting a potential reversal in the stock price.
- Williams %R: The Williams %R is in oversold territory, indicating a possible buying opportunity.
Volatility Analysis:
- Bollinger Bands: The stock price has been trading within the lower Bollinger Band, indicating oversold conditions.
- Bollinger %B: The %B indicator is below 0.2, suggesting that the stock price is nearing oversold levels.
Volume Analysis:
- On-Balance Volume (OBV): The OBV has been fluctuating, indicating mixed buying and selling pressure.
- Chaikin Money Flow (CMF): The CMF has been positive but decreasing, suggesting a potential decrease in buying pressure.
Key Observations and Opinions:
- Trend: The stock is in a short-term downtrend based on moving averages, but the MACD signals a potential bullish reversal.
- Momentum: The momentum indicators suggest a possible reversal in the oversold territory.
- Volatility: The stock is currently oversold based on Bollinger Bands, indicating a potential bounce back.
- Volume: Mixed signals from volume indicators imply uncertainty in market sentiment.
Conclusion:
Based on the analysis of technical indicators, the stock price of IRBT is likely to experience a short-term bullish reversal in the upcoming days. Traders may consider taking advantage of the oversold conditions indicated by the momentum and volatility indicators. However, it is essential to monitor the price action closely for confirmation of the reversal.