Technical Analysis of IREN 2024-05-10
Overview:
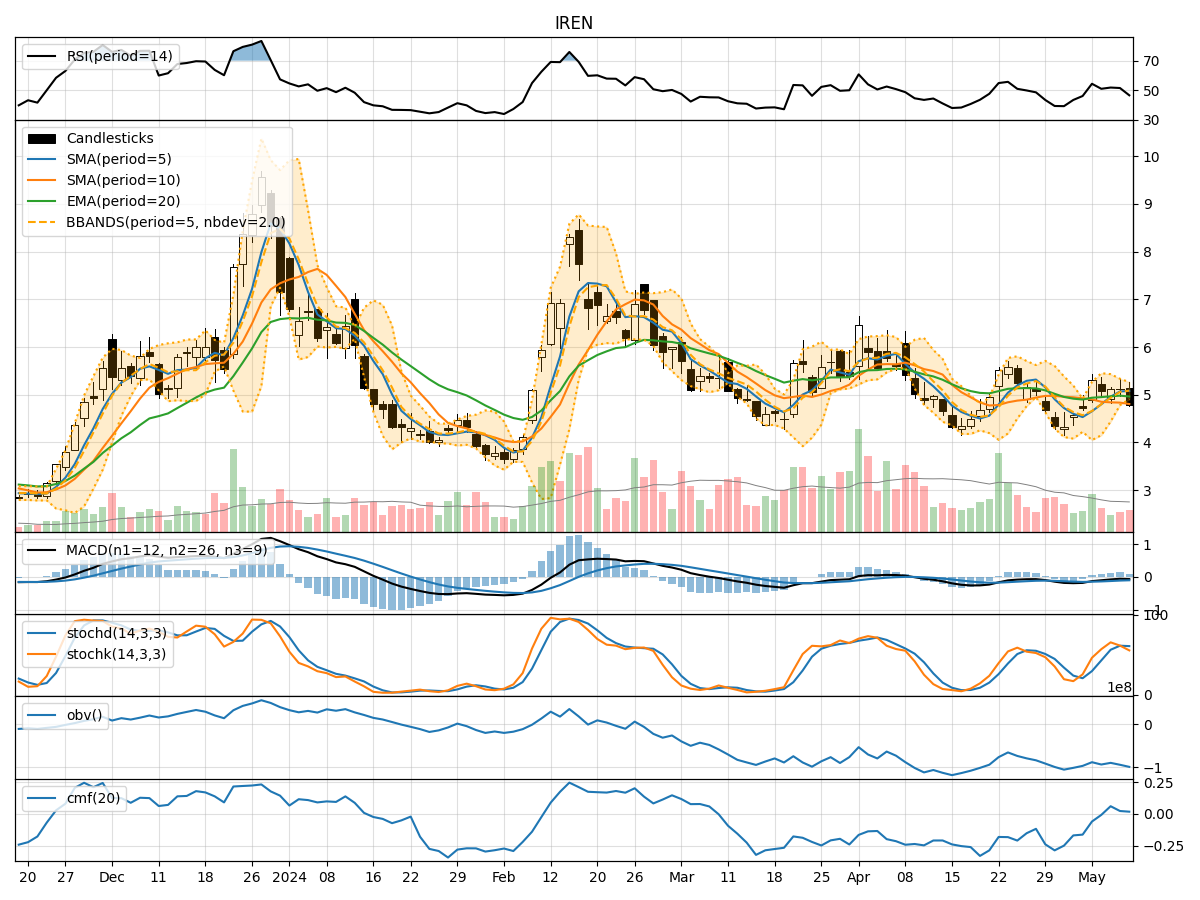
In analyzing the technical indicators for IREN over the last 5 days, we will delve into the trend, momentum, volatility, and volume indicators to provide a comprehensive outlook on the possible stock price movement in the coming days. By examining these key factors, we aim to offer valuable insights and recommendations for potential investors.
Trend Analysis:
- Moving Averages (MA): The 5-day Moving Average (MA) has been consistently above the closing prices, indicating a potential bullish trend.
- MACD: The Moving Average Convergence Divergence (MACD) has shown positive values, suggesting a bullish momentum in the short term.
- EMA: The Exponential Moving Average (EMA) has been trending upwards, supporting the bullish sentiment.
Momentum Analysis:
- RSI: The Relative Strength Index (RSI) has been fluctuating around the neutral zone, indicating a lack of strong momentum either way.
- Stochastic Oscillator: Both %K and %D have been in the overbought territory, suggesting a potential reversal or consolidation.
- Williams %R: The Williams %R is in the oversold region, signaling a possible buying opportunity.
Volatility Analysis:
- Bollinger Bands: The Bollinger Bands have been narrowing, indicating decreasing volatility and a potential price breakout in the near future.
- Bollinger %B: The %B indicator is close to the lower band, suggesting a possible oversold condition.
Volume Analysis:
- On-Balance Volume (OBV): The OBV has been declining, indicating selling pressure in the market.
- Chaikin Money Flow (CMF): The CMF has been fluctuating around the zero line, reflecting a balance between buying and selling pressure.
Key Observations:
- The trend indicators suggest a bullish sentiment in the short term.
- Momentum indicators show mixed signals, with potential for a reversal or consolidation.
- Volatility is decreasing, hinting at a possible price breakout.
- Volume indicators indicate selling pressure but with a balanced flow of buying and selling.
Conclusion:
Based on the analysis of the technical indicators, the next few days for IREN stock price movement could see sideways consolidation with a slight bullish bias. Traders should closely monitor the narrowing Bollinger Bands for a potential breakout, while also considering the overbought and oversold conditions highlighted by the momentum indicators. It is advisable to wait for clearer signals before making significant trading decisions.