Technical Analysis of IRON 2024-05-31
Overview:
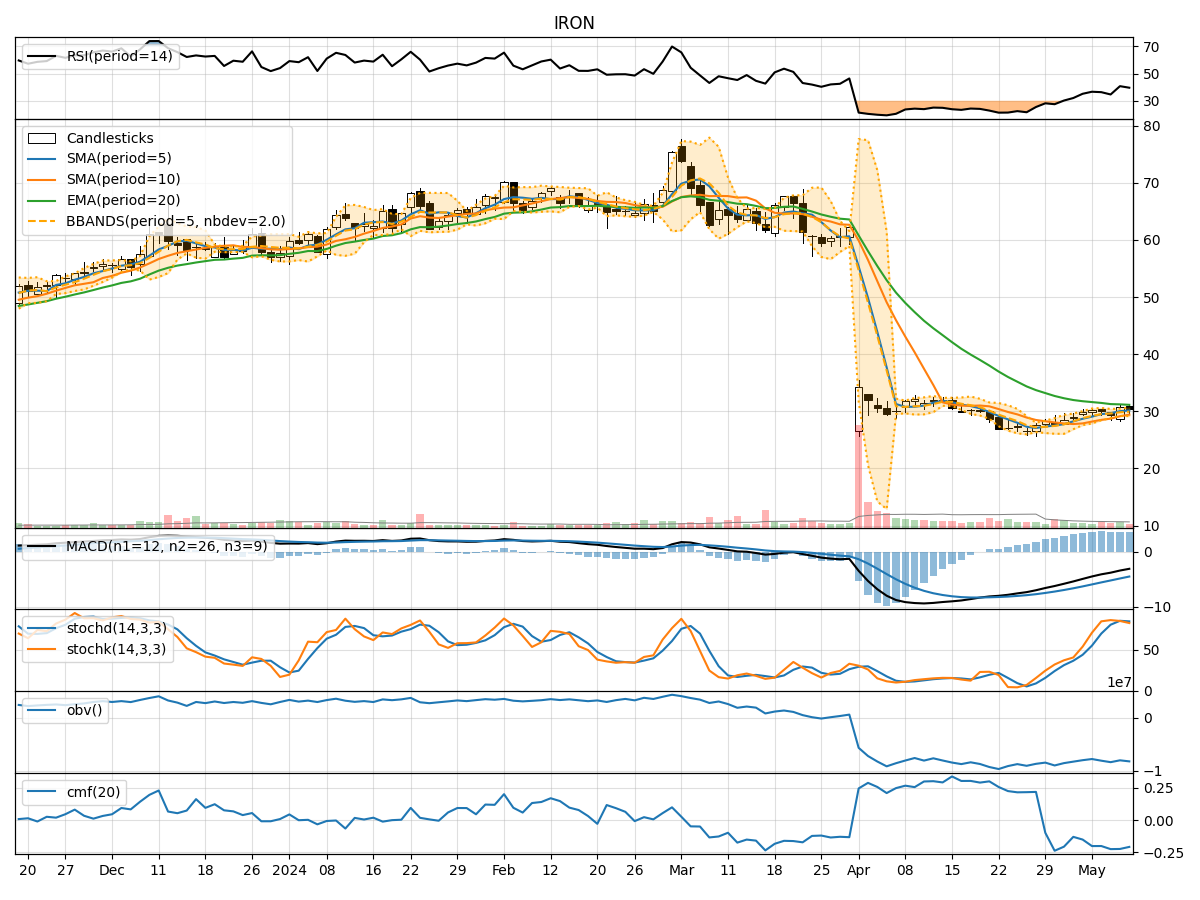
In analyzing the technical indicators for IRON stock over the last 5 days, we will delve into the trends, momentum, volatility, and volume indicators to provide a comprehensive outlook on the possible stock price movement in the upcoming days.
Trend Indicators:
- Moving Averages (MA): The 5-day Moving Average has been consistently rising, indicating a bullish trend in the short term.
- MACD: The MACD line has been negative but converging towards the signal line, suggesting a potential reversal in the bearish momentum.
- MACD Histogram: The histogram has been decreasing but showing signs of stabilization, hinting at a possible shift in momentum.
Momentum Indicators:
- RSI: The Relative Strength Index has been fluctuating around the neutral zone, indicating indecision in the market.
- Stochastic Oscillator: Both %K and %D have been declining, signaling a bearish momentum.
- Williams %R: The indicator has been in oversold territory, suggesting a potential reversal to the upside.
Volatility Indicators:
- Bollinger Bands: The bands have been narrowing, indicating decreasing volatility and a possible period of consolidation.
- Bollinger %B: The %B indicator has been hovering around the middle, reflecting a balanced market sentiment.
Volume Indicators:
- On-Balance Volume (OBV): The OBV has been fluctuating, showing mixed buying and selling pressure.
- Chaikin Money Flow (CMF): The CMF has been positive, indicating accumulation in the stock.
Key Observations and Opinions:
- Trend: The moving averages suggest a bullish trend, while the MACD indicates a potential reversal. The stock may experience a short-term uptrend.
- Momentum: The RSI and Stochastic Oscillator show mixed signals, reflecting market indecision. However, the Williams %R in oversold territory could signal a bullish reversal.
- Volatility: The narrowing Bollinger Bands suggest a period of consolidation, while the %B indicator indicates a balanced sentiment.
- Volume: The OBV and CMF show mixed signals, with no clear direction in buying or selling pressure.
Conclusion:
Based on the analysis of the technical indicators, the next few days for IRON stock could see sideways movement with a slight bullish bias. Traders should monitor the MACD for a potential trend reversal confirmation and watch for any significant volume spikes to validate the price movements. It is essential to exercise caution and wait for clearer signals before making significant trading decisions.