Technical Analysis of IZM 2024-05-10
Overview:
In analyzing the technical indicators for IZM stock over the last 5 days, we will delve into the trends, momentum, volatility, and volume indicators to provide a comprehensive outlook on the possible future stock price movement. By examining these key aspects, we aim to offer valuable insights and predictions for the upcoming trading days.
Trend Analysis:
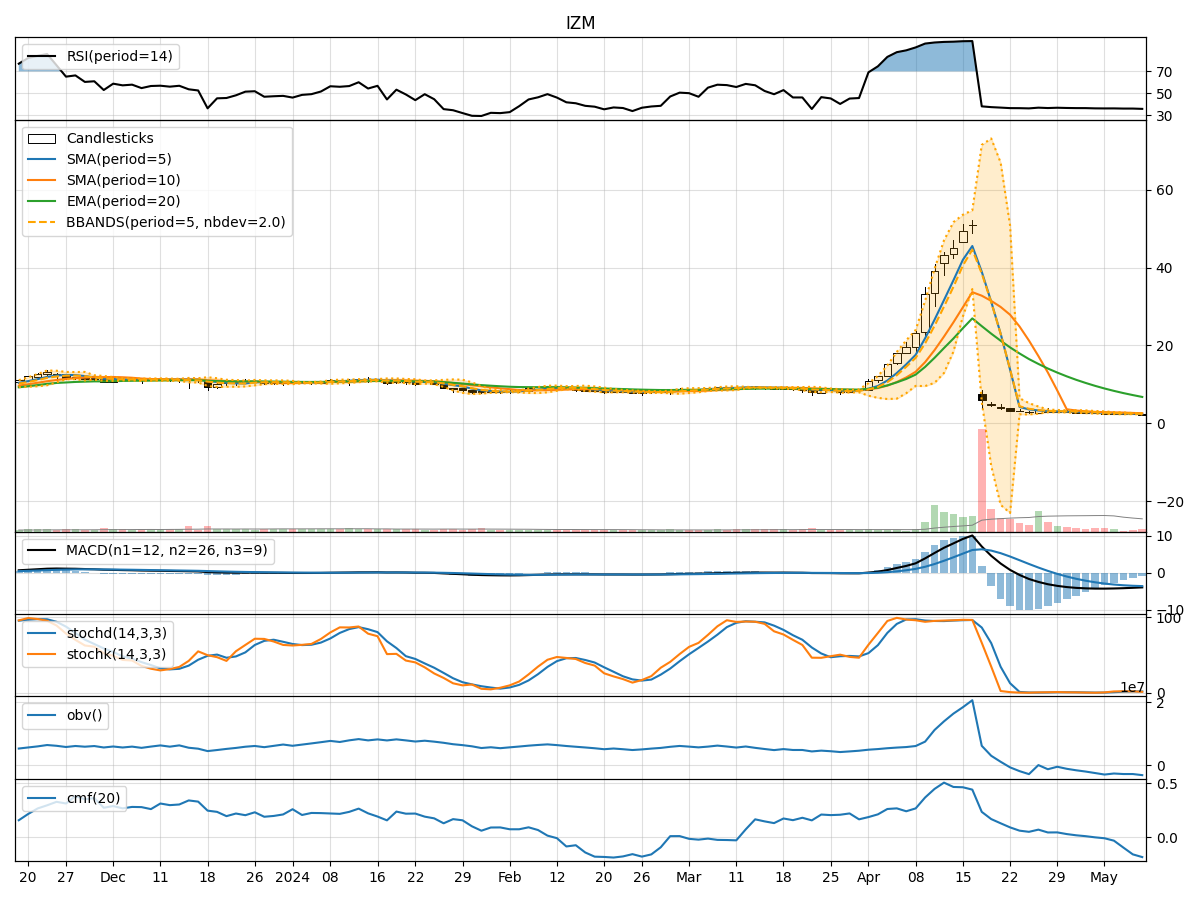
- Moving Averages (MA): The 5-day MA has been consistently decreasing, indicating a downward trend in the stock price.
- MACD: The MACD line has been negative and decreasing, suggesting bearish momentum in the stock.
- EMA: The exponential moving average has also been declining, reinforcing the bearish sentiment in the stock.
Momentum Analysis:
- RSI: The Relative Strength Index has been hovering around 35-36, indicating a neutral to slightly bearish momentum.
- Stochastic Oscillator: Both %K and %D have been relatively low, signaling a potential oversold condition in the stock.
- Williams %R: The Williams %R is showing the stock is in oversold territory, potentially hinting at a reversal.
Volatility Analysis:
- Bollinger Bands: The stock price has been consistently below the lower Bollinger Band, suggesting oversold conditions and potential for a reversal.
- Bollinger %B: The %B indicator is very low, indicating that the stock is trading at the lower end of its recent price range.
Volume Analysis:
- On-Balance Volume (OBV): The OBV has been declining, indicating selling pressure in the stock.
- Chaikin Money Flow (CMF): The CMF has been negative, suggesting outflow of money from the stock.
Key Observations and Opinions:
- Trend: The stock is in a clear downtrend based on moving averages and MACD.
- Momentum: Momentum indicators suggest a potential reversal due to oversold conditions.
- Volatility: The stock is oversold according to Bollinger Bands, indicating a possible bounce.
- Volume: Selling pressure is evident from the declining OBV and negative CMF.
Conclusion:
Based on the analysis of technical indicators, the next few days for IZM stock could see a potential reversal or short-term bounce in price. Traders might consider monitoring for signs of a bullish reversal, especially if momentum indicators start to show strength. However, it is crucial to wait for confirmation signals before making any trading decisions.