Technical Analysis of JBHT 2024-05-10
Overview:
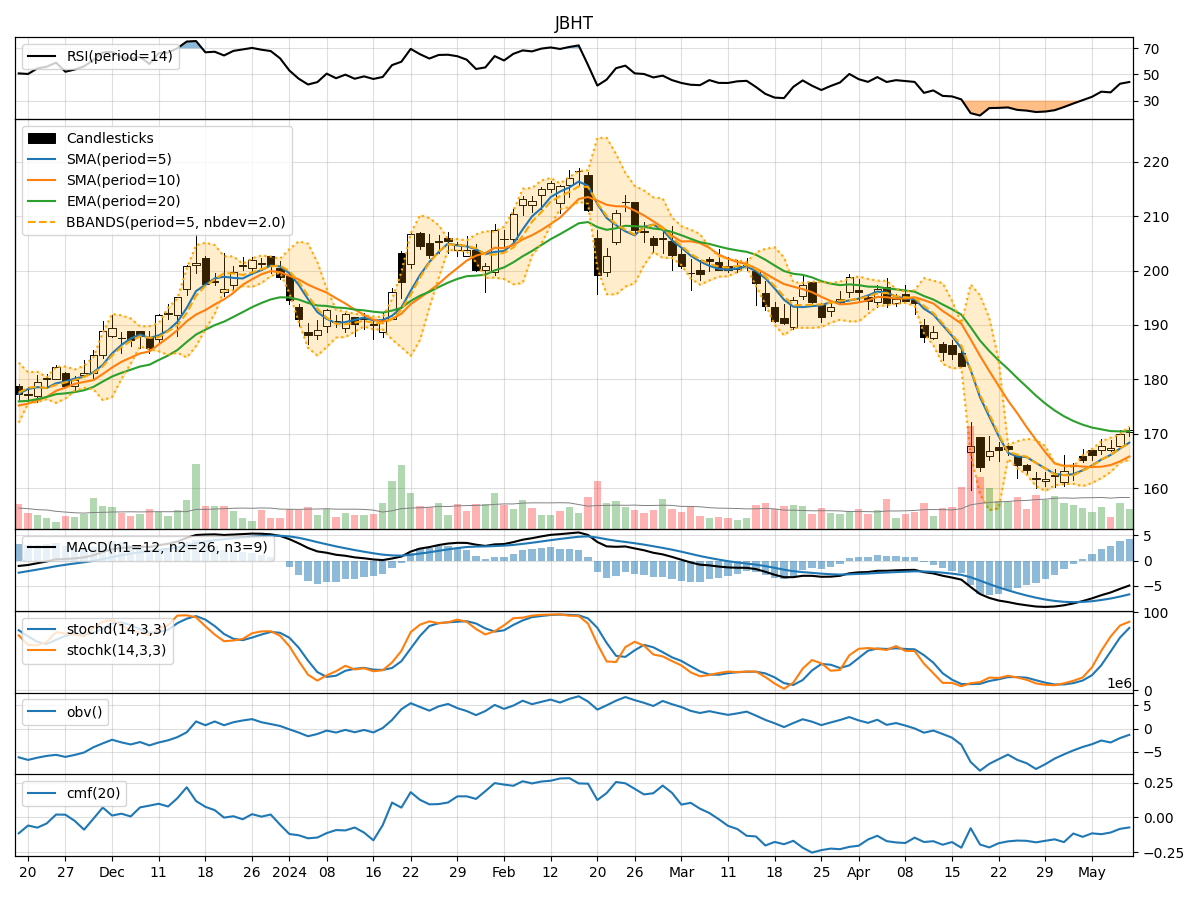
In analyzing the technical indicators for JB Hunt Transport Services Inc. (JBHT) over the last 5 days, we will delve into the trend, momentum, volatility, and volume indicators to provide a comprehensive outlook on the possible stock price movement in the coming days.
Trend Indicators:
- Moving Averages (MA): The 5-day Moving Average (MA) has been consistently rising, indicating a bullish trend in the short term.
- MACD: The MACD line has been increasing, showing bullish momentum, and the MACD Histogram has been consistently positive, supporting the uptrend.
- EMA: The Exponential Moving Average (EMA) has been trending downwards slightly, suggesting a potential reversal or consolidation.
Momentum Indicators:
- RSI: The Relative Strength Index (RSI) has been increasing, indicating strengthening bullish momentum.
- Stochastic Oscillator: Both %K and %D have been in the overbought zone, suggesting a potential pullback or consolidation.
- Williams %R: The Williams %R is in the oversold territory, indicating a potential reversal to the upside.
Volatility Indicators:
- Bollinger Bands: The stock price has been trading near the upper Bollinger Band, indicating high volatility and a potential overbought condition.
- Bollinger %B: The %B indicator is above 0.8, suggesting a potential overbought situation.
Volume Indicators:
- On-Balance Volume (OBV): The OBV has been declining, indicating selling pressure in the stock.
- Chaikin Money Flow (CMF): The CMF has been negative, suggesting outflow of money from the stock.
Key Observations and Opinions:
- Trend: The trend indicators suggest a short-term bullish bias, supported by rising moving averages and positive MACD.
- Momentum: Momentum indicators show mixed signals with RSI indicating bullish momentum, while Stochastic Oscillator suggests a potential pullback.
- Volatility: High volatility near the upper Bollinger Band indicates a potential overbought condition and a likely correction.
- Volume: Declining OBV and negative CMF signal selling pressure and a lack of buying interest.
Conclusion:
Based on the analysis of the technical indicators, the next few days for JBHT stock price could see a potential consolidation or pullback. The stock has shown signs of being overbought, coupled with declining volume indicators and mixed momentum signals. Traders should exercise caution and consider waiting for a clearer trend confirmation before making any significant trading decisions.