Technical Analysis of JCSE 2024-05-10
Overview:
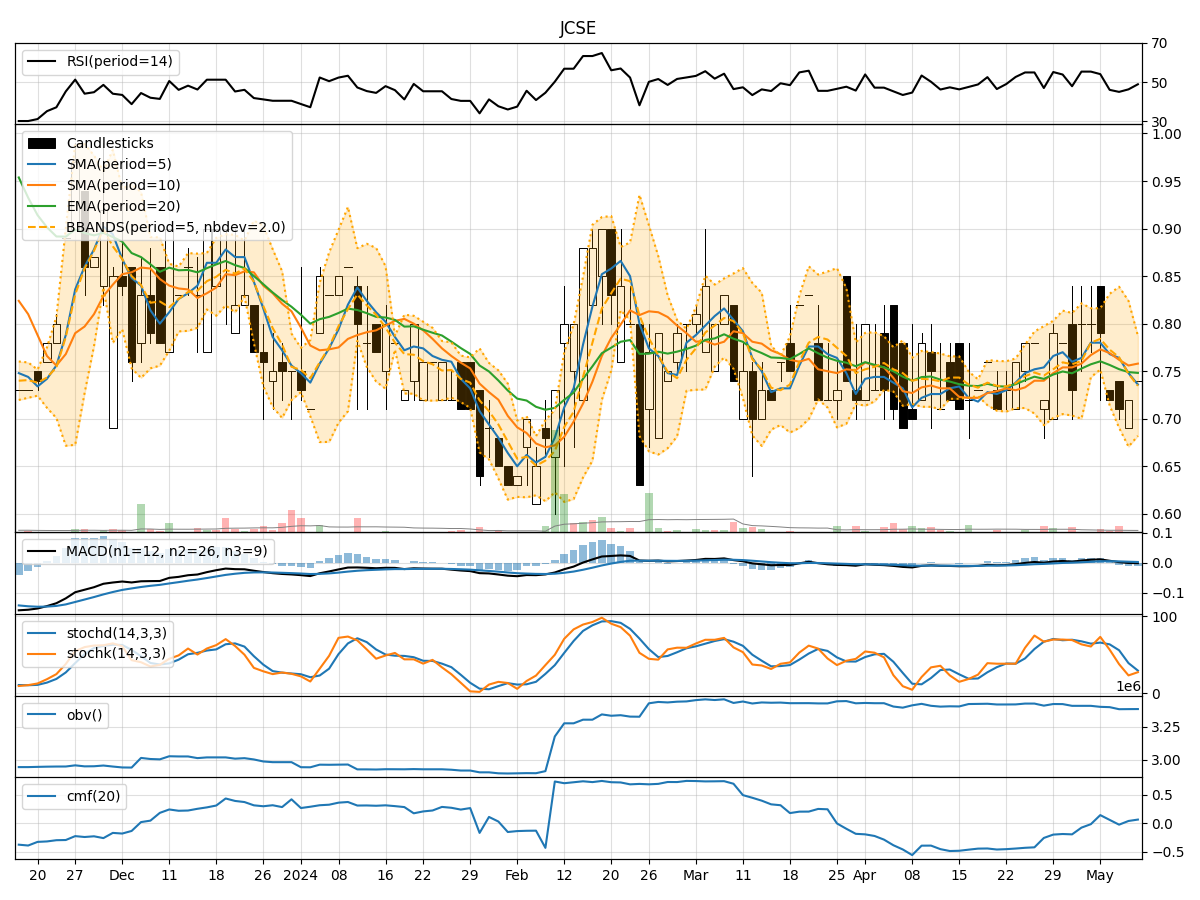
In analyzing the technical indicators for JCSE over the last 5 days, we will delve into the trend, momentum, volatility, and volume indicators to provide a comprehensive outlook on the possible stock price movement. By examining these key factors, we aim to offer valuable insights and predictions for the upcoming days.
Trend Analysis:
- Moving Averages (MA): The 5-day MA has been fluctuating around the closing prices, indicating short-term price trends. The SMA(10) and EMA(20) have shown a slight decline, suggesting a weakening trend.
- Moving Average Convergence Divergence (MACD): The MACD and Signal line have been hovering around the zero line, indicating a lack of strong momentum in either direction.
- Conclusion: The trend indicators suggest a sideways movement with a slightly bearish bias.
Momentum Analysis:
- Relative Strength Index (RSI): The RSI has been oscillating around the 50 level, reflecting a balanced momentum between buying and selling pressure.
- Stochastic Oscillator: Both %K and %D have been in the oversold region, indicating a potential reversal in price direction.
- Williams %R: The Williams %R has been fluctuating in the oversold territory, signaling a possible buying opportunity.
- Conclusion: The momentum indicators suggest a potential reversal in the stock price movement.
Volatility Analysis:
- Bollinger Bands (BB): The bands have been narrowing, indicating decreasing volatility in the stock price.
- Conclusion: The volatility indicators suggest a consolidation phase with reduced price fluctuations.
Volume Analysis:
- On-Balance Volume (OBV): The OBV has shown mixed movements, reflecting indecision among market participants.
- Chaikin Money Flow (CMF): The CMF has been positive, indicating some buying pressure in the market.
- Conclusion: The volume indicators suggest a neutral stance with no clear direction.
Overall Conclusion:
Based on the analysis of the technical indicators, the next few days for JCSE stock price movement are likely to see a sideways consolidation with a potential for a reversal in momentum. Traders should exercise caution and wait for clearer signals before taking significant positions. It is advisable to closely monitor key support and resistance levels for potential breakout opportunities.
Key Recommendations:
- Monitor Price Levels: Keep a close eye on key support and resistance levels for potential breakout or breakdown scenarios.
- Wait for Confirmation: Wait for confirmation from multiple indicators before making trading decisions.
- Risk Management: Implement proper risk management strategies to protect capital in case of unexpected price movements.
- Stay Informed: Stay updated on market news and events that could impact the stock price.
By considering these recommendations and staying vigilant in monitoring the evolving market dynamics, traders can navigate the upcoming days with a well-informed and strategic approach.