Technical Analysis of JFBR 2024-05-10
Overview:
In analyzing the technical indicators for JFBR over the last 5 days, we will delve into the trend, momentum, volatility, and volume indicators to provide a comprehensive outlook on the possible stock price movement. By examining these key aspects, we aim to offer valuable insights and predictions for the upcoming days.
Trend Analysis:
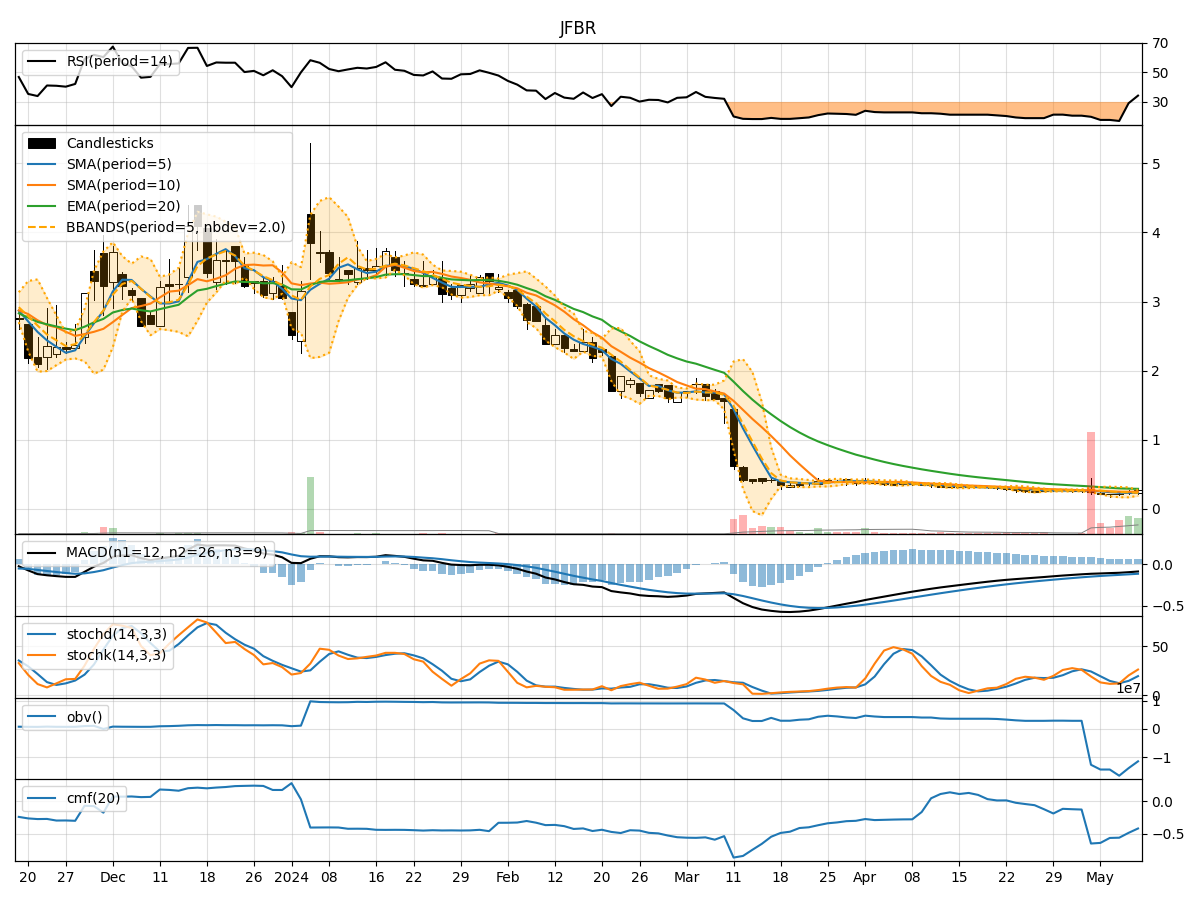
- Moving Averages (MA): The 5-day MA has been consistently below the closing prices, indicating a short-term downtrend.
- MACD: The MACD line has been negative, suggesting bearish momentum in the stock.
- EMA: The EMA has been declining, reflecting a weakening trend.
Momentum Analysis:
- RSI: The RSI has been relatively low, indicating oversold conditions in the stock.
- Stochastic Oscillator: Both %K and %D have been trending upwards but remain in the oversold territory.
- Williams %R: The Williams %R is also in the oversold region, signaling a potential reversal.
Volatility Analysis:
- Bollinger Bands (BB): The stock price has been trading below the lower Bollinger Band, indicating oversold conditions.
- Bollinger Band Width: The Band Width has been expanding, suggesting increased volatility.
- Bollinger Band %B: %B has been below 0.2, indicating an oversold condition.
Volume Analysis:
- On-Balance Volume (OBV): The OBV has been declining, indicating selling pressure in the stock.
- Chaikin Money Flow (CMF): The CMF has been negative, reflecting a lack of buying interest.
Key Observations:
- The stock is currently in a downtrend based on moving averages and MACD.
- Momentum indicators suggest the stock is oversold and may see a potential reversal.
- Volatility has increased, indicating a high level of uncertainty in the market.
- Volume indicators point towards selling pressure and a lack of buying interest.
Conclusion:
Based on the analysis of the technical indicators, the next few days for JFBR are likely to see a potential reversal in the stock price. The oversold conditions indicated by momentum indicators, coupled with the expanding volatility, may lead to a short-term bounce in the stock price. However, it is essential to monitor the price action closely for any signs of a sustainable uptrend. Caution is advised for traders and investors, as the stock remains in a challenging technical position.