Technical Analysis of JG 2024-05-10
Overview:
In analyzing the technical indicators for JG stock over the last 5 days, we will delve into the trend, momentum, volatility, and volume indicators to provide a comprehensive outlook on the possible future stock price movement. By examining these key indicators, we aim to offer valuable insights and recommendations for potential investors.
Trend Analysis:
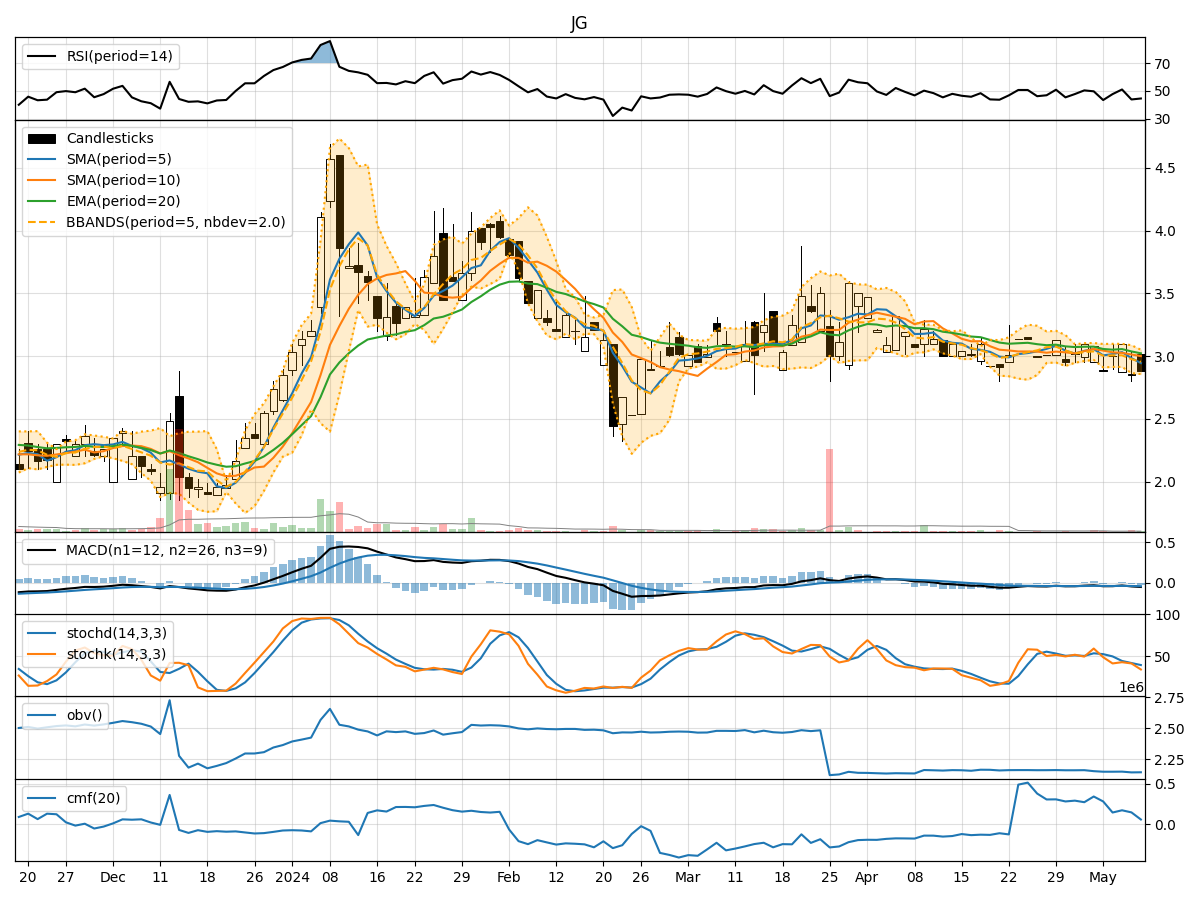
- Moving Averages (MA): The 5-day Moving Average (MA) has been consistently below the Simple Moving Average (SMA) and Exponential Moving Average (EMA), indicating a downward trend in the stock price.
- MACD: The Moving Average Convergence Divergence (MACD) has been negative, with the MACD line below the signal line, suggesting bearish momentum in the stock.
Momentum Analysis:
- RSI: The Relative Strength Index (RSI) has been below 50, indicating a lack of strong buying momentum in the stock.
- Stochastic Oscillator: Both %K and %D have been below 50, signaling a potential oversold condition in the stock.
Volatility Analysis:
- Bollinger Bands (BB): The stock price has been trading within the lower Bollinger Band, suggesting a period of low volatility and potential consolidation.
Volume Analysis:
- On-Balance Volume (OBV): The OBV has been negative, indicating more selling volume than buying volume in the stock.
- Chaikin Money Flow (CMF): The CMF has been relatively low, reflecting a lack of strong buying pressure in the stock.
Key Observations:
- The stock is currently in a downtrend based on moving averages and MACD.
- Momentum indicators suggest a lack of strong buying momentum.
- Volatility is low, indicating a period of consolidation.
- Volume indicators show more selling pressure than buying pressure.
Conclusion:
Based on the analysis of the technical indicators, the next few days' possible stock price movement for JG is likely to be sideways with a bearish bias. Investors should exercise caution and consider waiting for more definitive signals before making any significant trading decisions. It is advisable to monitor the stock closely for any potential reversal patterns or significant shifts in the technical indicators before considering entry or exit points.
Disclaimer:
Remember that technical analysis is not a guaranteed predictor of future price movements, and other fundamental factors and market dynamics can influence stock prices. It is essential to consider multiple indicators and conduct thorough research before making any investment decisions. Consulting with a financial advisor can provide valuable insights tailored to your specific investment goals and risk tolerance level.