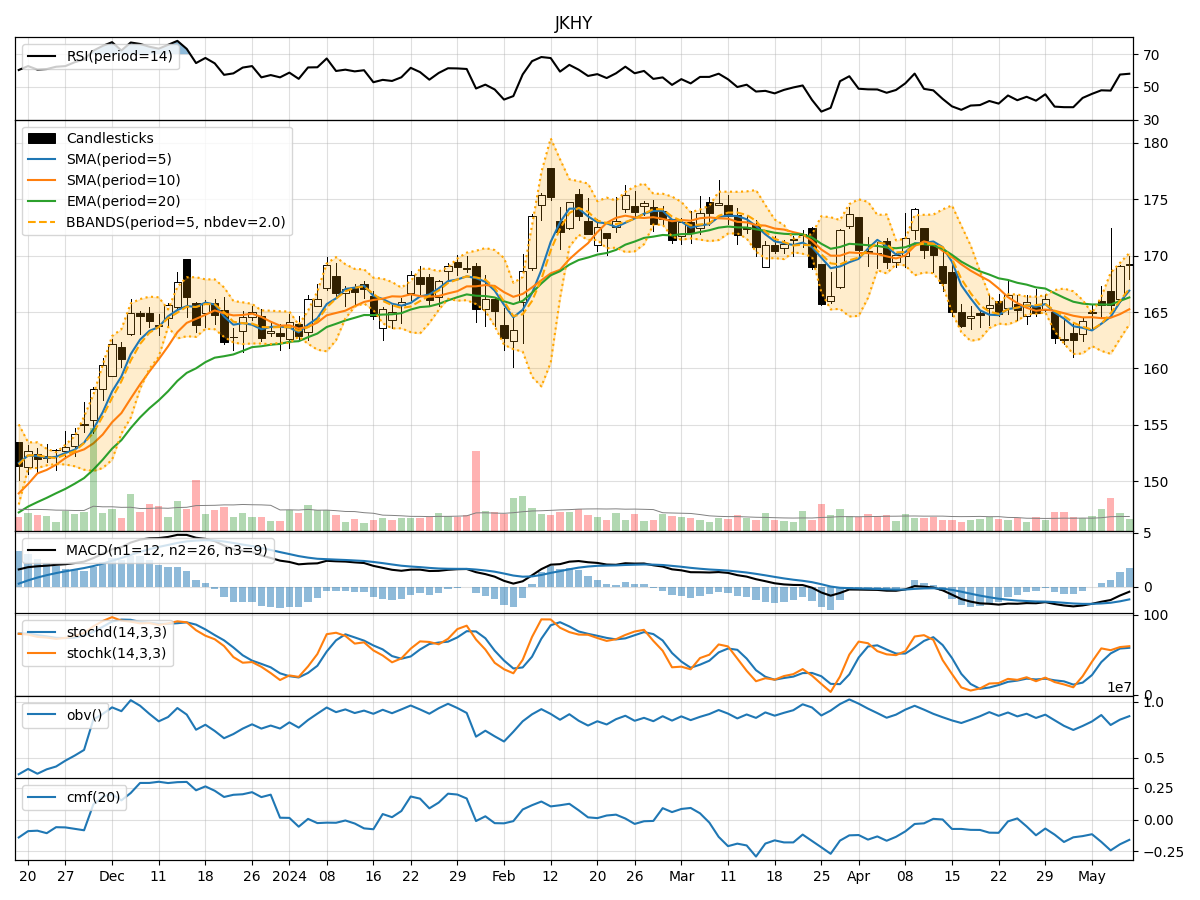
Technical Analysis of JKHY 2024-05-10
Overview:
In analyzing the technical indicators for JKHY over the last 5 days, we will delve into the trend, momentum, volatility, and volume indicators to provide a comprehensive outlook on the possible stock price movement in the coming days.
Trend Analysis:
- Moving Averages (MA): The 5-day Moving Average (MA) has been consistently above the closing prices, indicating a bullish trend.
- MACD: The MACD has been positive for the past 5 days, with the MACD line above the signal line, suggesting bullish momentum.
- EMA: The Exponential Moving Average (EMA) has been trending upwards, supporting the bullish sentiment.
Momentum Analysis:
- RSI: The Relative Strength Index (RSI) has been increasing, indicating strengthening momentum.
- Stochastic Oscillator: Both %K and %D have been in the overbought zone, suggesting a potential reversal or consolidation.
- Williams %R: The Williams %R is in the oversold region, indicating a possible buying opportunity.
Volatility Analysis:
- Bollinger Bands (BB): The stock price has been consistently trading above the middle Bollinger Band, indicating an uptrend.
- Bollinger %B: The %B indicator shows the stock is trading close to the upper band, suggesting a bullish trend continuation.
Volume Analysis:
- On-Balance Volume (OBV): The OBV has shown mixed signals, with fluctuations in volume accumulation.
- Chaikin Money Flow (CMF): The CMF has been negative, indicating selling pressure in the stock.
Key Observations:
- The trend indicators suggest a strong bullish sentiment with moving averages and MACD supporting an upward trajectory.
- Momentum indicators show a mix of overbought and oversold conditions, signaling a potential reversal or consolidation.
- Volatility indicators indicate an uptrend with the stock consistently trading above the middle Bollinger Band.
- Volume indicators show mixed signals with OBV fluctuating and CMF indicating selling pressure.
Conclusion:
Based on the analysis of technical indicators, the overall outlook for JKHY in the next few days is bullish. The trend indicators, supported by moving averages and MACD, suggest a continuation of the upward momentum. However, caution is advised as momentum indicators show potential signs of a reversal or consolidation. Volatility indicators support the bullish trend, while volume indicators present a mixed picture.
Recommendation:
- Short-term: Consider holding or adding to existing positions with a bullish bias.
- Long-term: Monitor closely for any signs of reversal or consolidation before making significant investment decisions.
Disclaimer:
This analysis is based solely on technical indicators and does not account for fundamental factors or external market influences. It is essential to conduct thorough research and consider multiple factors before making investment decisions.