Technical Analysis of JRSH 2024-05-31
Overview:
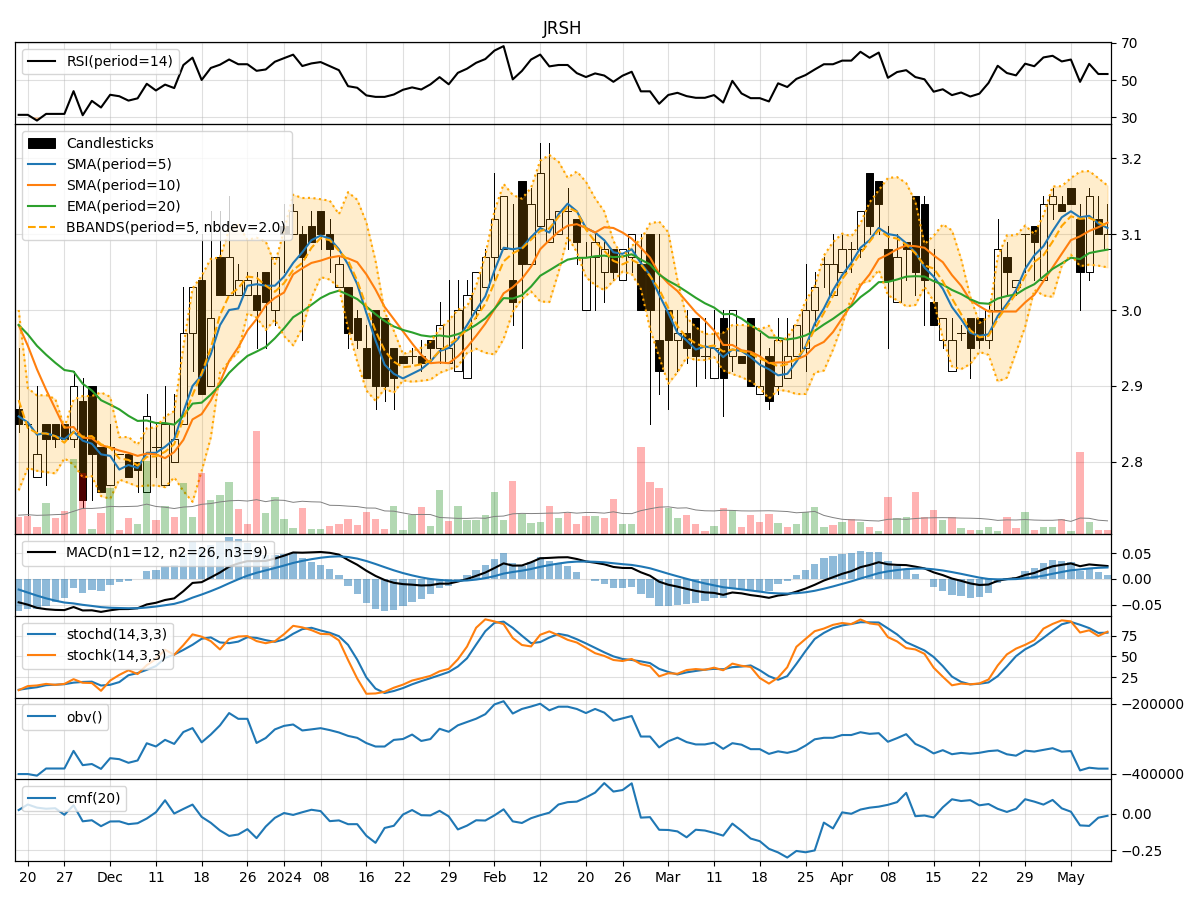
In analyzing the technical indicators for JRSH over the last 5 days, we will delve into the trend, momentum, volatility, and volume indicators to provide a comprehensive outlook on the possible stock price movement in the coming days.
Trend Indicators:
- Moving Averages (MA): The 5-day MA has been gradually decreasing from 3.034 to 2.998, indicating a short-term bearish trend.
- MACD: The MACD line has been consistently below the signal line, with the MACD histogram showing a decreasing trend, signaling a bearish momentum.
- EMA: The 20-day EMA has been declining, further supporting the bearish sentiment in the short to medium term.
Momentum Indicators:
- RSI: The RSI has been fluctuating around the 50 level, suggesting a lack of strong momentum in either direction.
- Stochastic Oscillator: Both %K and %D have been trending downwards, indicating weakening buying pressure.
- Williams %R: The indicator has been in oversold territory, reflecting a potential reversal in the near future.
Volatility Indicators:
- Bollinger Bands: The bands have been narrowing, indicating decreasing volatility and a potential breakout in the near term.
- Bollinger %B: The %B indicator has been hovering around the lower band, suggesting a possible oversold condition.
Volume Indicators:
- On-Balance Volume (OBV): The OBV has been declining, indicating distribution and selling pressure in the stock.
- Chaikin Money Flow (CMF): The CMF has been negative, reflecting a bearish money flow trend.
Key Observations:
- The stock is currently in a short-term bearish trend based on moving averages and MACD.
- Momentum indicators suggest a lack of strong buying pressure and a potential reversal in the near future.
- Volatility is decreasing, indicating a possible consolidation phase before a breakout.
- Volume indicators show selling pressure and a bearish money flow trend.
Conclusion:
Based on the analysis of the technical indicators, the stock is likely to experience further downward movement in the near term. The bearish trend indicated by moving averages and MACD, coupled with weakening momentum and negative volume indicators, suggest a continuation of the current downtrend. Traders should exercise caution and consider shorting or staying on the sidelines until a clear reversal pattern emerges.