Technical Analysis of JVSA 2024-05-10
Overview:
In analyzing the technical indicators for JVSA over the last 5 days, we will delve into the trend, momentum, volatility, and volume indicators to provide a comprehensive outlook on the possible stock price movement in the coming days. By examining these key aspects, we aim to offer valuable insights and predictions for potential investors.
Trend Indicators:
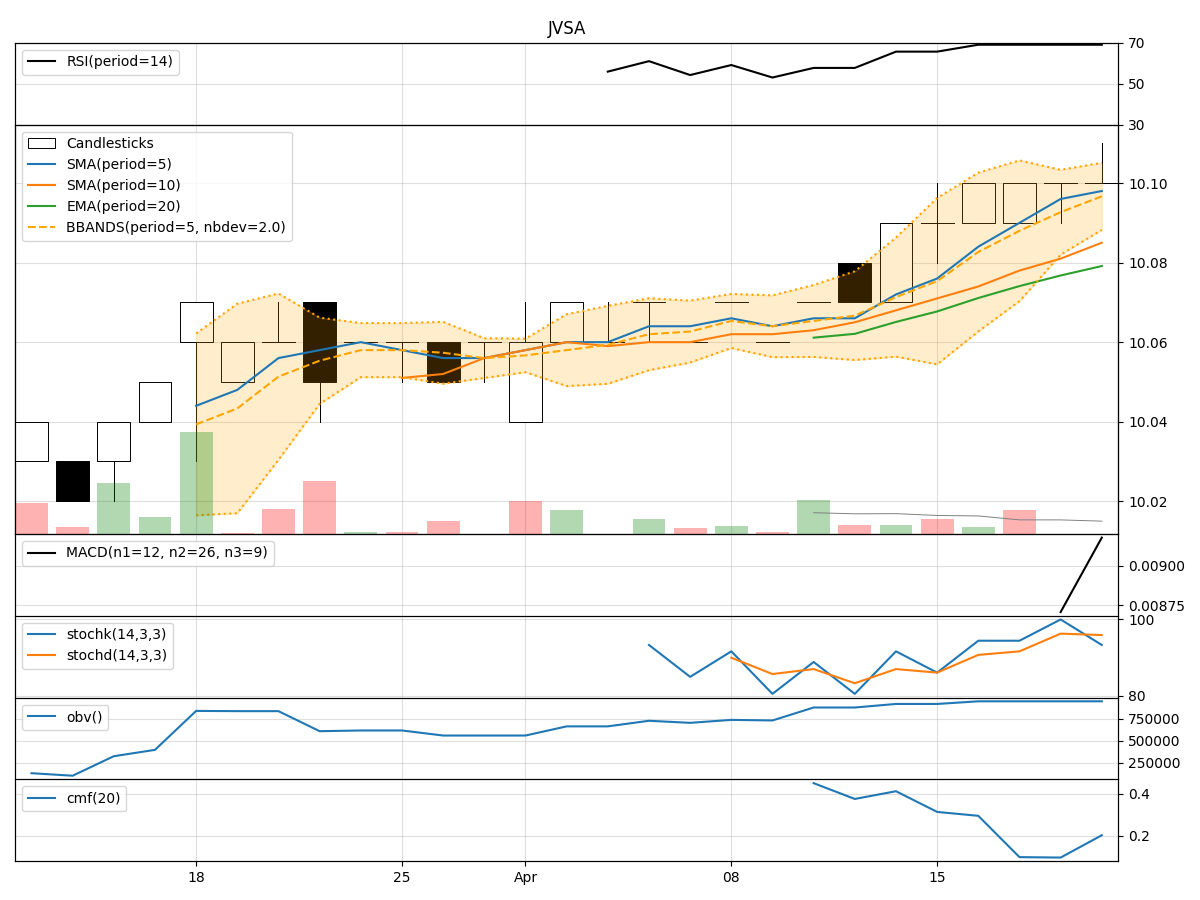
- Moving Averages (MA): The 5-day moving average has been relatively stable around $10.10, indicating a consistent price trend.
- MACD: The MACD line has been positive, suggesting a bullish momentum in the short term.
- EMA: The exponential moving average has shown a slight uptrend, supporting the bullish sentiment.
Key Observation: The trend indicators point towards a mildly bullish outlook for JVSA.
Momentum Indicators:
- RSI: The Relative Strength Index has been fluctuating around the mid-level, indicating a neutral momentum.
- Stochastic Oscillator: Both %K and %D have shown mixed signals, with recent fluctuations in momentum.
- Williams %R: The indicator has been hovering in the oversold territory, suggesting a potential reversal.
Key Observation: Momentum indicators are inconclusive, reflecting a lack of clear direction in the short term.
Volatility Indicators:
- Bollinger Bands: The bands have remained relatively narrow, indicating low volatility and a period of consolidation.
- Bollinger %B: The %B indicator has shown stability around the midline, further confirming the consolidation phase.
Key Observation: Volatility indicators signal a period of consolidation and range-bound trading.
Volume Indicators:
- On-Balance Volume (OBV): The OBV has shown mixed movements, reflecting indecision among market participants.
- Chaikin Money Flow (CMF): The CMF has been positive, suggesting some buying pressure in the market.
Key Observation: Volume indicators indicate a lack of strong conviction among traders, with a slight bias towards buying pressure.
Conclusion:
Based on the analysis of the technical indicators, the next few days for JVSA are likely to see sideways movement with a slight bullish bias. The trend indicators support a mildly bullish outlook, while momentum indicators remain inconclusive. Volatility indicators point towards a period of consolidation, and volume indicators suggest a lack of strong conviction in either direction.
Overall, the stock is expected to trade within a narrow range in the near term, with a potential for a modest upside movement. Investors should closely monitor key support and resistance levels for potential trading opportunities.