Technical Analysis of KRKR 2024-05-10
Overview:
In analyzing the technical indicators for KRKR over the last 5 days, we will delve into the trend, momentum, volatility, and volume indicators to provide a comprehensive outlook on the possible stock price movement. By examining these key aspects, we aim to offer valuable insights and predictions for the upcoming days.
Trend Analysis:
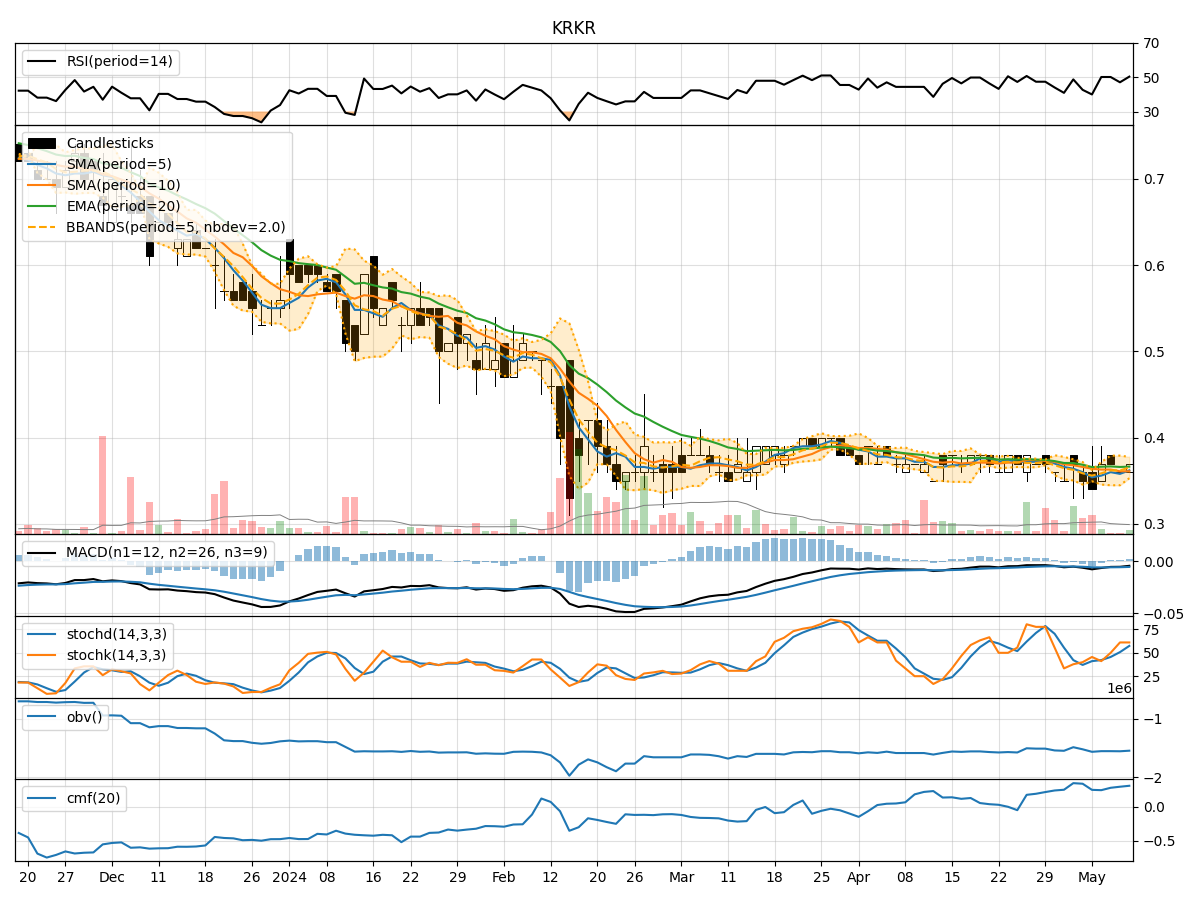
- Moving Averages (MA): The 5-day MA has been fluctuating around the 0.36-0.37 range, indicating a relatively stable price trend.
- MACD: The MACD line has been consistently below the signal line, suggesting a bearish momentum in the short term.
- EMA: The EMA has shown a slight upward trend, but the overall movement remains relatively flat.
Key Observation: The trend indicators suggest a lack of strong directional bias, with the stock price hovering around the moving averages.
Momentum Analysis:
- RSI: The RSI values have been oscillating around the 50 level, indicating a neutral momentum in the stock.
- Stochastic Oscillator: Both %K and %D values have been fluctuating, reflecting indecision in the market.
- Williams %R: The indicator has shown oversold conditions but has failed to trigger a significant reversal.
Key Observation: Momentum indicators point towards a lack of clear momentum direction, with the stock price struggling to establish a strong trend.
Volatility Analysis:
- Bollinger Bands (BB): The bands have shown a slight expansion, indicating increased volatility in the stock price.
- Bollinger %B: The %B value has been fluctuating within a narrow range, suggesting consolidation.
- Average True Range (ATR): The ATR values have remained relatively stable, indicating consistent price movements.
Key Observation: Volatility indicators suggest a moderate level of volatility with no significant breakout or breakdown signals.
Volume Analysis:
- On-Balance Volume (OBV): The OBV values have shown mixed signals, reflecting alternating buying and selling pressure.
- Chaikin Money Flow (CMF): The CMF values have been gradually increasing, indicating a potential accumulation phase.
Key Observation: Volume indicators imply a balanced market sentiment with no clear dominance of buyers or sellers.
Conclusion:
Based on the analysis of trend, momentum, volatility, and volume indicators, the stock price of KRKR is likely to consolidate in the upcoming days. The lack of strong trends in both price and momentum, coupled with moderate volatility and balanced volume signals, suggests a period of sideways movement. Traders may expect the stock to trade within a narrow range without a clear directional bias.
Overall Outlook: Sideways consolidation is anticipated for KRKR in the near term, with the stock price likely to remain range-bound. Traders should exercise caution and wait for a clear breakout or breakdown signal before initiating significant positions.
Remember, market conditions can change rapidly, so it's essential to monitor the indicators regularly for any shifts in the stock's price dynamics.