Technical Analysis of KYMR 2024-05-31
Overview:
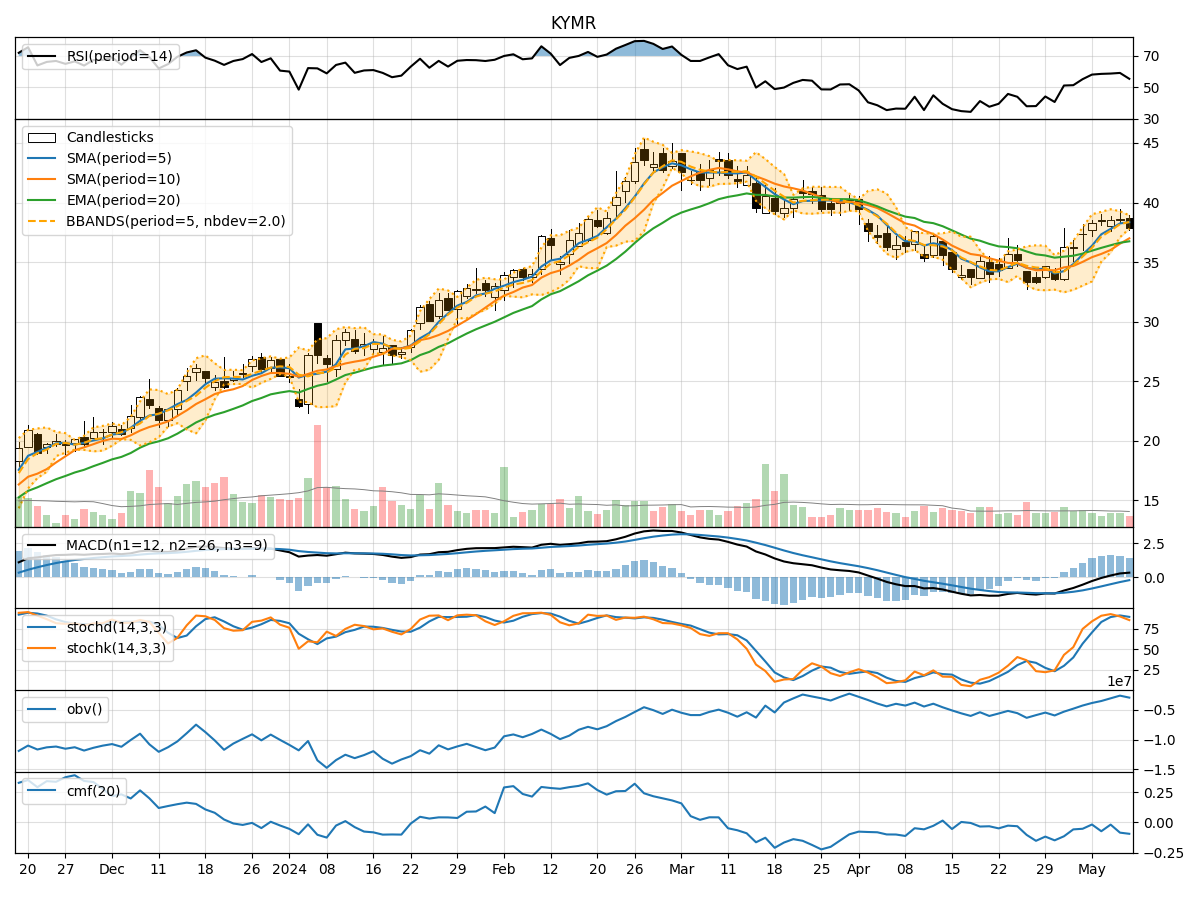
In analyzing the technical indicators for KYMR over the last 5 days, we will delve into the trend, momentum, volatility, and volume indicators to provide a comprehensive outlook on the possible stock price movement in the coming days.
Trend Analysis:
- Moving Averages (MA): The 5-day MA has been consistently below the closing prices, indicating a downward trend.
- MACD: The MACD line has been decreasing, with the MACD line consistently below the signal line, suggesting a bearish trend.
- EMA: The EMA has been declining, further confirming the bearish sentiment in the stock.
Momentum Analysis:
- RSI: The RSI has been decreasing, indicating weakening momentum.
- Stochastic Oscillator: Both %K and %D have been declining, showing a bearish momentum.
- Williams %R: The indicator has been in oversold territory, suggesting a potential reversal or continuation of the downtrend.
Volatility Analysis:
- Bollinger Bands (BB): The stock price has been consistently below the middle Bollinger Band, indicating a downtrend.
- BB Width: The Bollinger Bands width has been narrowing, suggesting decreasing volatility.
- BB %B: The %B has been below 0.2, indicating the stock is oversold.
Volume Analysis:
- On-Balance Volume (OBV): The OBV has been declining, indicating selling pressure.
- Chaikin Money Flow (CMF): The CMF has been negative, suggesting outflow of money from the stock.
Key Observations and Opinions:
- Trend: The stock is in a strong downtrend based on moving averages, MACD, and EMA.
- Momentum: Momentum indicators like RSI and Stochastic Oscillator support a bearish sentiment.
- Volatility: The narrowing Bollinger Bands width and oversold %B indicate low volatility but a potential reversal.
- Volume: The declining OBV and negative CMF signal selling pressure.
Conclusion:
Based on the technical analysis of trend, momentum, volatility, and volume indicators, the next few days are likely to see a continuation of the bearish trend in KYMR. Investors should exercise caution as the stock shows no immediate signs of reversal. Consider waiting for a clear signal of trend reversal before considering any long positions.