Technical Analysis of LAMR 2024-05-10
Overview:
In analyzing the technical indicators for LAMR over the last 5 days, we will delve into the trend, momentum, volatility, and volume indicators to provide a comprehensive outlook on the possible stock price movement. By examining these key factors, we aim to offer valuable insights and predictions for the upcoming days.
Trend Indicators:
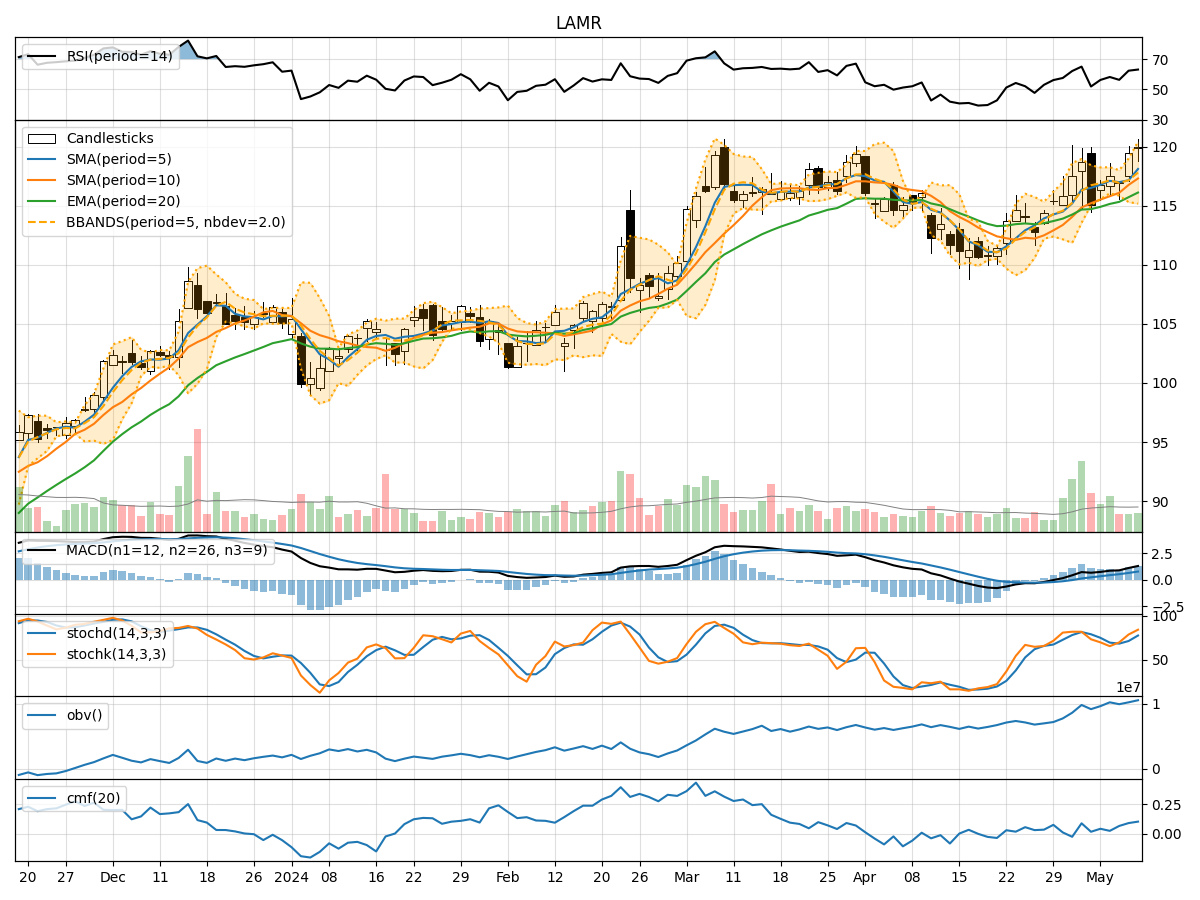
- Moving Averages (MA): The 5-day MA has been fluctuating around the closing prices, indicating short-term price trends. The SMA(10) and EMA(20) have shown a gradual increase, suggesting a positive trend.
- MACD: The MACD line has been consistently above the signal line, indicating bullish momentum in the stock.
- MACD Histogram: The histogram has been increasing, reflecting strengthening bullish momentum.
Momentum Indicators:
- RSI: The RSI has been in the neutral zone, indicating neither overbought nor oversold conditions.
- Stochastic Oscillator: Both %K and %D have been in the overbought territory, suggesting a potential reversal in the short term.
- Williams %R: The indicator has been hovering in the oversold region, signaling a possible buying opportunity.
Volatility Indicators:
- Bollinger Bands: The stock price has been trading within the bands, indicating normal volatility levels.
- Bollinger Band Width: The band width has been relatively stable, suggesting consistent price movements.
Volume Indicators:
- On-Balance Volume (OBV): The OBV has shown a positive trend, indicating accumulation by investors.
- Chaikin Money Flow (CMF): The CMF has been positive, reflecting buying pressure in the stock.
Key Observations:
- The trend indicators suggest a bullish sentiment with moving averages trending upwards and MACD showing strong positive momentum.
- Momentum indicators indicate a mixed signal with RSI in the neutral zone, stochastic oscillator in overbought territory, and Williams %R in oversold region.
- Volatility indicators show normal price fluctuations within the Bollinger Bands.
- Volume indicators point towards accumulation and buying pressure in the stock.
Conclusion:
Based on the analysis of the technical indicators, the overall outlook for LAMR in the next few days is bullish. The trend indicators support a positive momentum, while volume indicators indicate investor interest in the stock. However, caution is advised as momentum indicators show conflicting signals, with stochastic oscillator in the overbought region and Williams %R in the oversold territory. Traders and investors should closely monitor these indicators for any potential reversal or consolidation in the stock price.