Technical Analysis of LATG 2024-05-10
Overview:
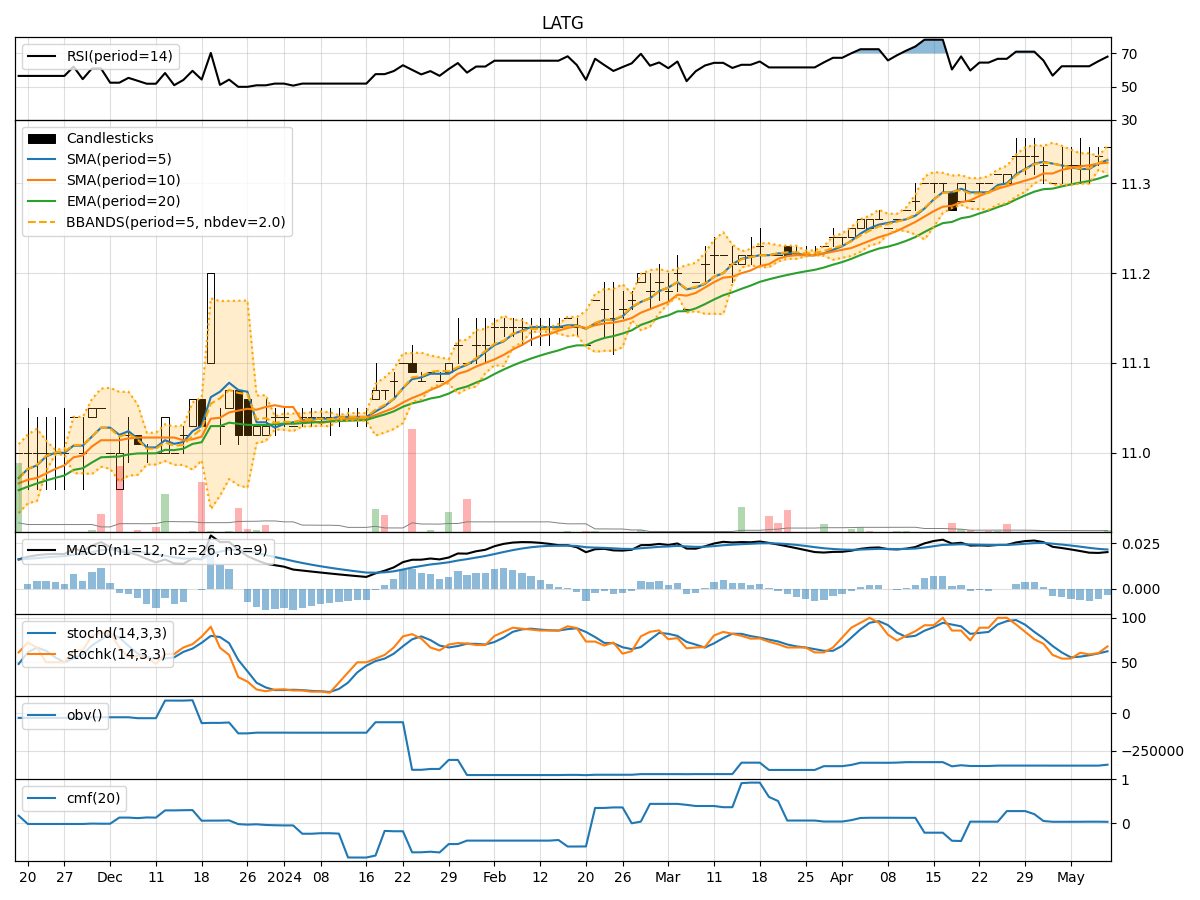
In analyzing the technical indicators for LATG over the last 5 days, we will delve into the trend, momentum, volatility, and volume indicators to provide a comprehensive outlook on the possible stock price movement in the coming days. By examining these key aspects, we aim to offer valuable insights and predictions to guide your investment decisions.
Trend Indicators:
- Moving Averages (MA): The 5-day MA has been steadily increasing, indicating a positive trend in the stock price.
- MACD: The MACD line has been consistently above the signal line, suggesting bullish momentum.
- EMA: The exponential moving average has also been on an upward trajectory, supporting the bullish sentiment.
Key Observation: The trend indicators point towards a bullish outlook for LATG.
Momentum Indicators:
- RSI: The Relative Strength Index has been rising and is currently in the overbought territory, indicating strong buying momentum.
- Stochastic Oscillator: Both %K and %D lines are trending upwards, signaling increasing buying pressure.
- Williams %R: The indicator is in the oversold region, suggesting a potential reversal in the stock price.
Key Observation: Momentum indicators reflect a bullish sentiment with some signs of potential reversal due to overbought conditions.
Volatility Indicators:
- Bollinger Bands: The stock price has been trading within the bands, indicating normal volatility.
- Bollinger %B: The %B is fluctuating around the midline, suggesting balanced volatility.
- Bollinger Band Width: The band width has remained relatively stable, indicating consistent volatility levels.
Key Observation: Volatility indicators suggest a sideways movement with no significant spikes in volatility.
Volume Indicators:
- On-Balance Volume (OBV): The OBV has been increasing, indicating accumulation of the stock.
- Chaikin Money Flow (CMF): The CMF is positive, suggesting buying pressure in the stock.
Key Observation: Volume indicators support the bullish sentiment with increasing accumulation and buying pressure.
Conclusion:
Based on the analysis of trend, momentum, volatility, and volume indicators, the overall outlook for LATG is bullish with a potential for continued upward movement in the stock price. The positive trend, strong momentum, stable volatility, and increasing volume accumulation all point towards a favorable environment for potential price appreciation in the coming days.
Recommendation:
Considering the bullish signals across multiple technical indicators, it is advisable to consider buying or holding LATG shares for potential capital appreciation. However, it is essential to monitor the market closely for any signs of reversal or increased volatility to adjust your investment strategy accordingly.