Technical Analysis of LAZR 2024-05-10
Overview:
In analyzing the technical indicators for LAZR over the last 5 days, we will delve into the trend, momentum, volatility, and volume indicators to provide a comprehensive outlook on the possible stock price movement. By examining these key aspects, we aim to offer valuable insights and predictions for the upcoming days.
Trend Analysis:
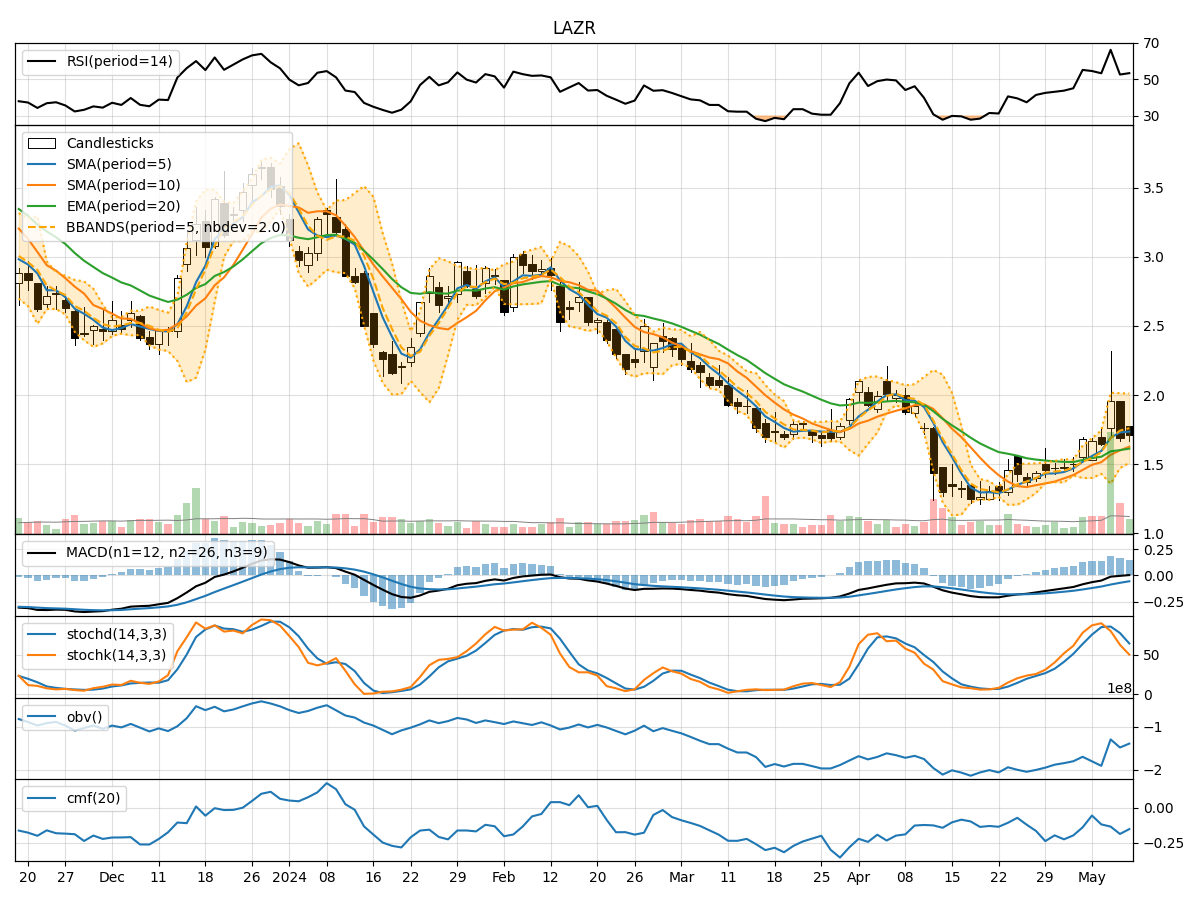
- Moving Averages (MA): The 5-day moving average has been consistently above the closing prices, indicating a bullish trend.
- MACD: The MACD line has been positive, but the MACD histogram has been decreasing, suggesting a potential weakening of the bullish momentum.
Momentum Analysis:
- RSI: The Relative Strength Index has been fluctuating around the neutral zone, indicating indecision in the market.
- Stochastic Oscillator: Both %K and %D have been declining, signaling a potential bearish momentum.
Volatility Analysis:
- Bollinger Bands: The stock price has been trading within the bands, with the %B indicator hovering around the midline, suggesting a period of consolidation.
Volume Analysis:
- On-Balance Volume (OBV): The OBV has been negative, indicating selling pressure in the market.
- Chaikin Money Flow (CMF): The CMF has been consistently negative, reflecting a lack of buying interest.
Key Observations:
- The trend indicators show a bullish sentiment, but the weakening MACD histogram raises concerns.
- Momentum indicators suggest a shift towards bearish momentum, especially with the declining Stochastic Oscillator.
- Volatility indicators point towards a period of consolidation, with the stock price trading within the Bollinger Bands.
- Volume indicators highlight selling pressure and a lack of buying interest in the market.
Conclusion:
Based on the analysis of the technical indicators, the next few days for LAZR stock price movement could be sideways with a slight bearish bias. The weakening momentum, negative volume indicators, and lack of significant buying interest suggest a potential consolidation phase or a minor pullback in the stock price. Traders should exercise caution and closely monitor key support and resistance levels for potential entry or exit points.
Recommendation:
- Short-term Traders: Consider taking profits or tightening stop-loss levels to manage risk.
- Long-term Investors: Monitor the price action for potential buying opportunities at key support levels.
By staying informed and adapting to changing market dynamics, investors can make well-informed decisions aligned with their risk tolerance and investment objectives.