Technical Analysis of LCFY 2024-05-10
Overview:
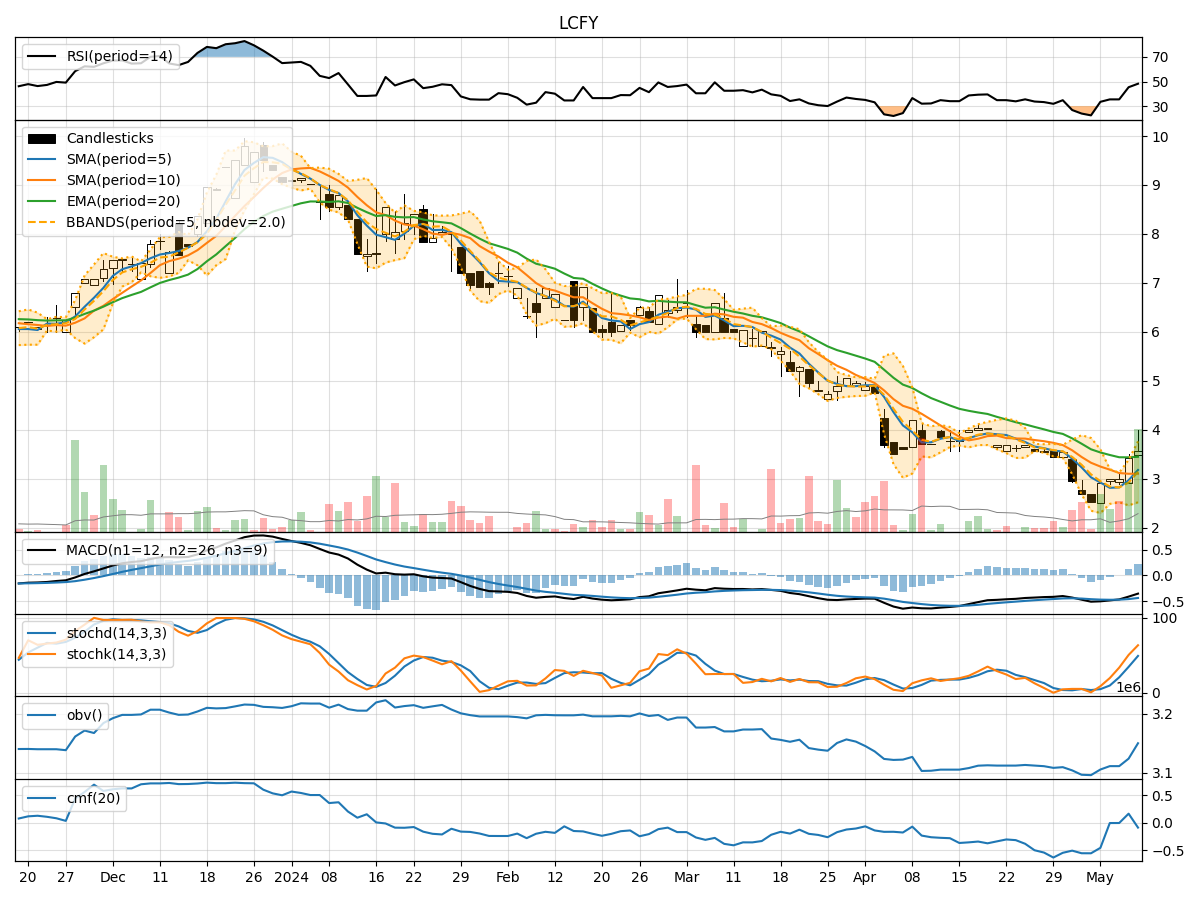
In analyzing the technical indicators for LCFY over the last 5 days, we will delve into the trend, momentum, volatility, and volume indicators to provide a comprehensive outlook on the possible stock price movement in the coming days. By examining these key indicators, we aim to offer valuable insights and predictions to guide your investment decisions.
Trend Analysis:
- Moving Averages (MA): The 5-day MA has been declining, indicating a short-term bearish trend.
- MACD: The MACD line has been below the signal line, suggesting a bearish momentum.
- EMA: The EMA has been trending downwards, reflecting a bearish sentiment in the stock.
Momentum Analysis:
- RSI: The RSI has been gradually increasing but remains below 50, indicating a neutral to slightly bullish momentum.
- Stochastic Oscillator: Both %K and %D have been rising, signaling a strengthening bullish momentum.
- Williams %R: The indicator has been fluctuating but is currently in the oversold territory, suggesting a potential reversal.
Volatility Analysis:
- Bollinger Bands (BB): The bands have been narrowing, indicating decreasing volatility in the stock.
- Bollinger %B: The %B has been fluctuating around the midline, reflecting a lack of clear direction in volatility.
Volume Analysis:
- On-Balance Volume (OBV): The OBV has been declining, suggesting selling pressure in the stock.
- Chaikin Money Flow (CMF): The CMF has been negative, indicating a bearish money flow trend.
Key Observations:
- The trend indicators point towards a bearish sentiment in the stock, with moving averages and MACD signaling a downward trend.
- Momentum indicators show a mixed picture, with RSI indicating a neutral stance while stochastic oscillators suggest a bullish momentum.
- Volatility has been decreasing, indicating a potential period of consolidation or sideways movement.
- Volume indicators reflect selling pressure and a bearish money flow trend.
Conclusion:
Based on the analysis of the technical indicators, the stock is likely to experience further downward movement in the short term. The bearish trend indicated by moving averages and MACD, coupled with the negative OBV and CMF, suggests a continuation of the current downward trajectory. While some momentum indicators show signs of a potential bullish reversal, the overall trend and volume indicators point towards a bearish outlook. Therefore, investors should exercise caution and consider waiting for more definitive signals before considering any long positions.