Technical Analysis of LFMD 2024-05-10
Overview:
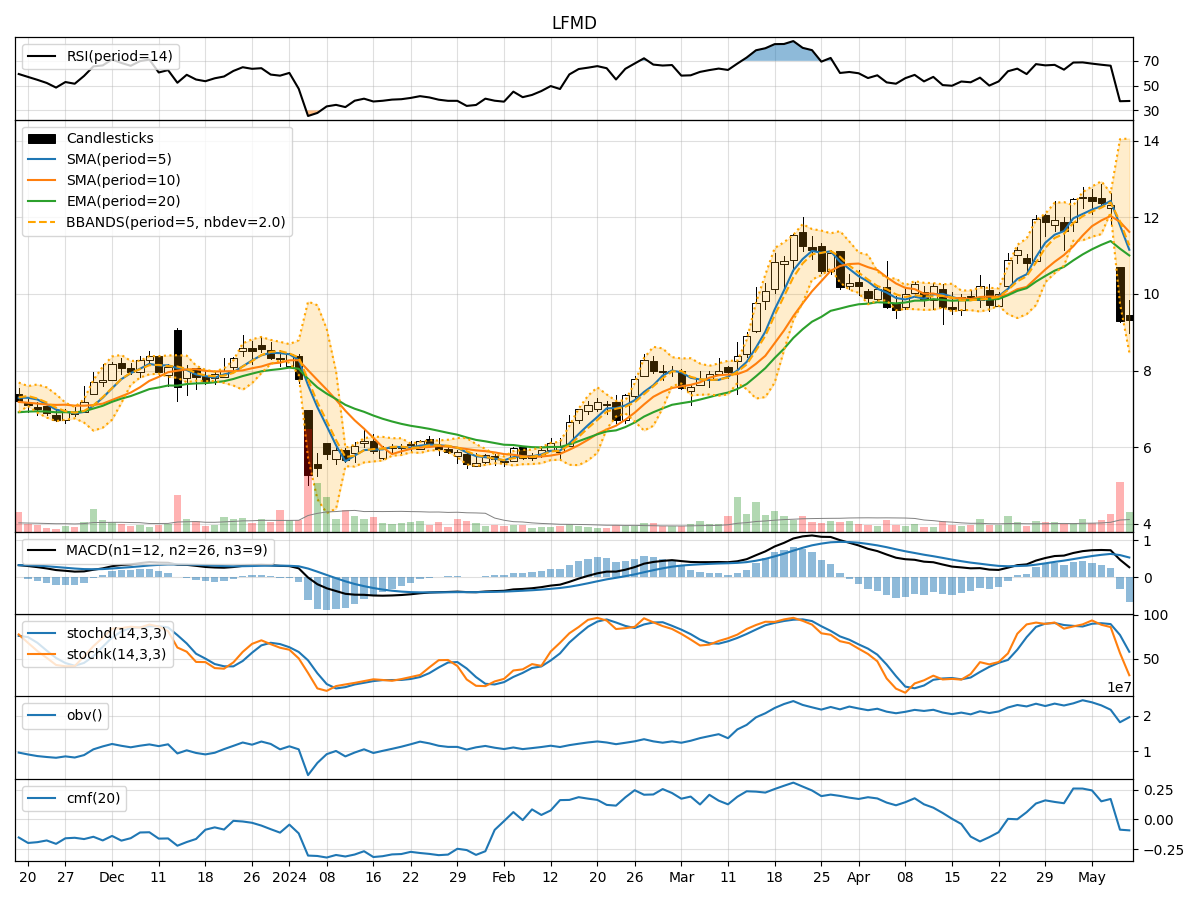
In analyzing the technical indicators for LFMD over the last 5 days, we will delve into the trend, momentum, volatility, and volume indicators to provide a comprehensive outlook on the possible stock price movement. By examining these key aspects, we aim to offer valuable insights and predictions for the upcoming days.
Trend Analysis:
- Moving Averages (MA): The 5-day Moving Average (MA) has been trending upwards, indicating a positive momentum in the short term.
- MACD: The MACD line has been consistently above the signal line, suggesting a bullish trend.
- RSI: The Relative Strength Index (RSI) has been fluctuating but generally staying within the neutral range, indicating a balanced market sentiment.
Momentum Analysis:
- Stochastic Oscillator: The Stochastic Oscillator has been showing oversold conditions, potentially signaling a reversal in the near future.
- Williams %R: The Williams %R indicator has been in the oversold territory, indicating a possible buying opportunity.
Volatility Analysis:
- Bollinger Bands: The Bollinger Bands have been narrowing, indicating decreasing volatility and a potential breakout in the near term.
- Average True Range (ATR): The ATR has decreased, suggesting a decrease in price volatility.
Volume Analysis:
- On-Balance Volume (OBV): The OBV has been fluctuating, indicating mixed buying and selling pressure.
- Chaikin Money Flow (CMF): The CMF has been negative, suggesting a bearish money flow trend.
Key Observations:
- The trend indicators suggest a bullish sentiment in the short term.
- Momentum indicators point towards a potential reversal in the oversold conditions.
- Volatility indicators indicate a potential breakout due to decreasing volatility.
- Volume indicators show mixed buying and selling pressure with a bearish money flow trend.
Conclusion:
Based on the analysis of the technical indicators, the next few days for LFMD could see upward movement in stock price. The bullish trend indicated by moving averages and MACD, coupled with potential reversals in oversold conditions as per momentum indicators, support this outlook. However, caution is advised due to mixed volume indicators and bearish money flow trend. Traders may consider taking long positions with proper risk management strategies in place.
Disclaimer:
This analysis is based solely on technical indicators and historical data, and actual market movements may vary. It is essential to consider other fundamental factors and conduct thorough research before making any investment decisions. Consulting with a financial advisor is recommended for personalized investment advice tailored to individual risk tolerance and financial goals.