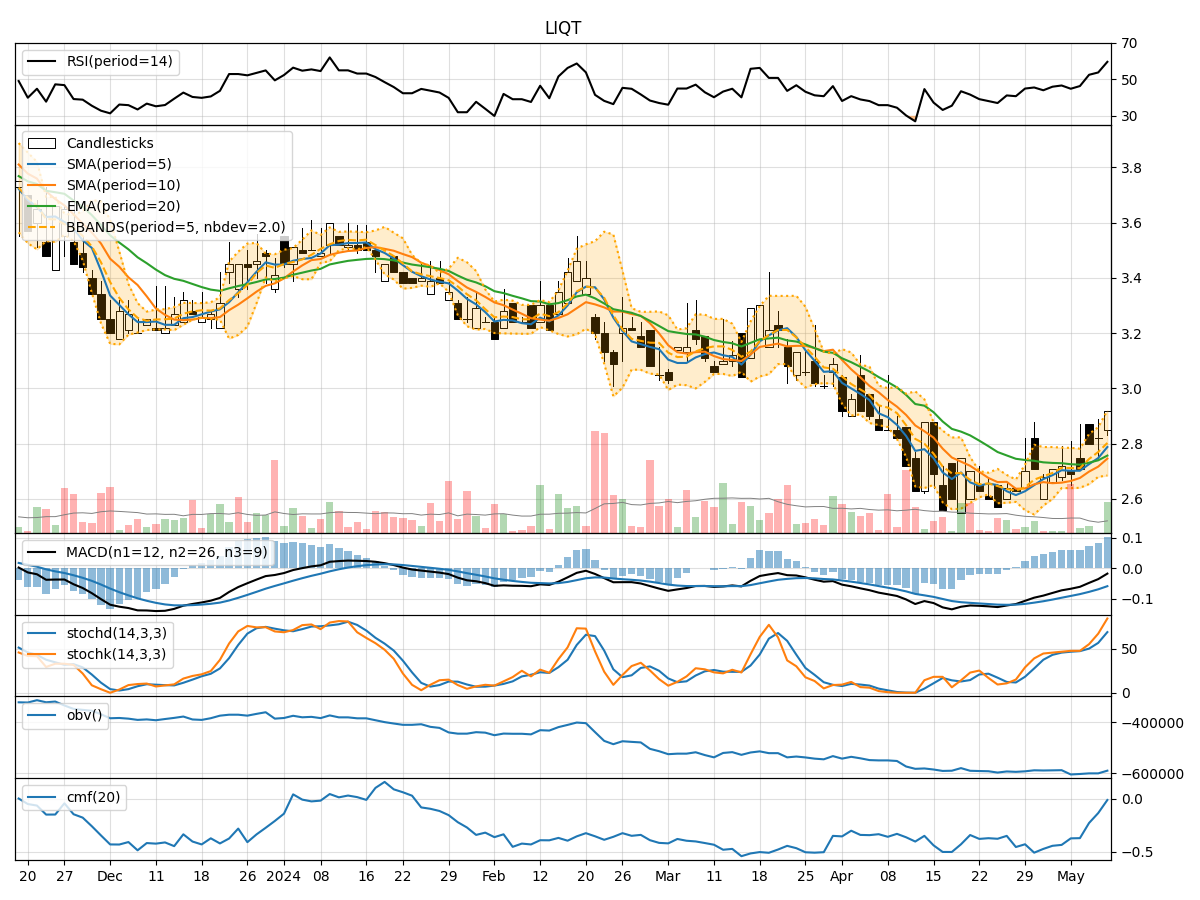
Technical Analysis of LIQT 2024-05-10
Overview:
In analyzing the technical indicators for LIQT over the last 5 days, we will delve into the trend, momentum, volatility, and volume indicators to provide a comprehensive outlook on the possible stock price movement. By examining these key aspects, we aim to offer valuable insights and predictions for the upcoming days.
Trend Analysis:
- Moving Averages (MA): The 5-day MA has been showing an upward trend, indicating a positive momentum in the stock price.
- MACD: The MACD line has been consistently below the signal line, suggesting a bearish trend in the short term.
- EMA: The EMA has been fluctuating but generally trending upwards, reflecting a potential bullish sentiment in the market.
Momentum Analysis:
- RSI: The RSI has been gradually increasing, indicating strengthening momentum in the stock.
- Stochastic Oscillator: Both %K and %D have been rising, signifying increasing buying pressure and potential upward movement.
- Williams %R: The indicator has been moving towards the oversold region, suggesting a possible reversal in the stock price.
Volatility Analysis:
- Bollinger Bands (BB): The bands have been widening, indicating increased volatility in the stock price.
- Bollinger %B: The %B has been fluctuating within a range, suggesting potential price reversals or breakouts.
- Bollinger Band Width: The band width has been expanding, indicating higher volatility and potential sharp price movements.
Volume Analysis:
- On-Balance Volume (OBV): The OBV has been declining, indicating selling pressure in the stock.
- Chaikin Money Flow (CMF): The CMF has been negative, suggesting outflow of money from the stock.
Key Observations and Opinions:
- Trend: The stock is exhibiting a mixed trend with bullish signals from moving averages but bearish signals from the MACD.
- Momentum: Momentum indicators are showing signs of strength and potential upward movement in the stock price.
- Volatility: Increasing volatility suggests potential price swings and trading opportunities.
- Volume: The declining OBV and negative CMF indicate bearish sentiment and selling pressure in the stock.
Conclusion:
Based on the analysis of technical indicators, the next few days for LIQT could see mixed price movements with a slight upward bias. While momentum indicators suggest a potential uptrend, the bearish signals from the MACD and volume indicators caution against a strong bullish view. Traders should closely monitor key levels and wait for confirmation before taking significant positions.