Technical Analysis of LITE 2024-05-10
Overview:
In analyzing the technical indicators for LITE over the last 5 days, we will delve into the trend, momentum, volatility, and volume indicators to provide a comprehensive outlook on the possible stock price movement in the coming days. By examining these key indicators, we aim to offer valuable insights and predictions for potential investors.
Trend Analysis:
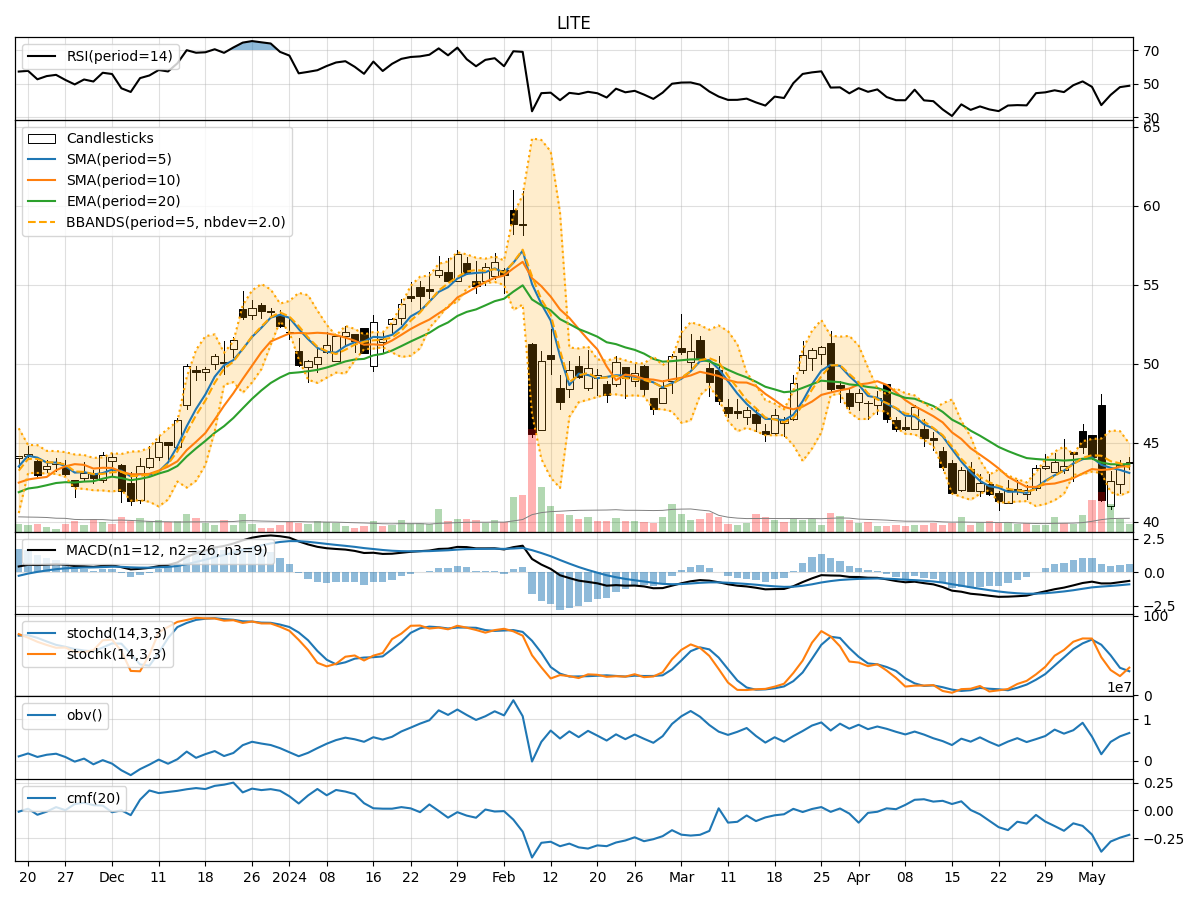
- Moving Averages (MA): The 5-day MA has been fluctuating around the closing prices, indicating short-term price trends. The SMA(10) and EMA(20) have shown a slight upward trend, suggesting a potential bullish sentiment.
- MACD: The MACD line has been negative, but the MACD Histogram has been gradually increasing, indicating a possible reversal in the bearish trend.
- Conclusion: The trend indicators suggest a potential bullish reversal in the short term.
Momentum Analysis:
- RSI: The RSI has been fluctuating but is currently below 50, indicating a neutral to bearish momentum.
- Stochastic Oscillator: Both %K and %D have been in the oversold region, suggesting a potential reversal to the upside.
- Conclusion: The momentum indicators imply a possible bullish momentum in the near future.
Volatility Analysis:
- Bollinger Bands (BB): The stock price has been trading within the bands, with the %B indicator hovering around 0.5, indicating a neutral stance.
- Conclusion: Volatility indicators suggest a sideways movement in the stock price.
Volume Analysis:
- On-Balance Volume (OBV): The OBV has been fluctuating but has not shown a clear trend, indicating indecision among investors.
- Chaikin Money Flow (CMF): The CMF has been negative, suggesting a bearish sentiment in the market.
- Conclusion: Volume indicators point towards uncertainty in the market sentiment.
Overall Conclusion:
Based on the analysis of trend, momentum, volatility, and volume indicators, the overall outlook for LITE in the next few days is as follows: - Trend: Potential bullish reversal indicated by moving averages and MACD. - Momentum: Possible bullish momentum suggested by stochastic oscillator. - Volatility: Anticipated sideways movement based on Bollinger Bands. - Volume: Indications of uncertainty in market sentiment based on OBV and CMF.
Final Recommendation:
Considering the mixed signals from the technical indicators, it is advisable for investors to exercise caution and closely monitor the stock price movement. While there are signs of a potential bullish reversal in the short term, the overall market sentiment remains uncertain. It is recommended to wait for more confirmation from the indicators before making any significant trading decisions.