Technical Analysis of LITM 2024-05-10
Overview:
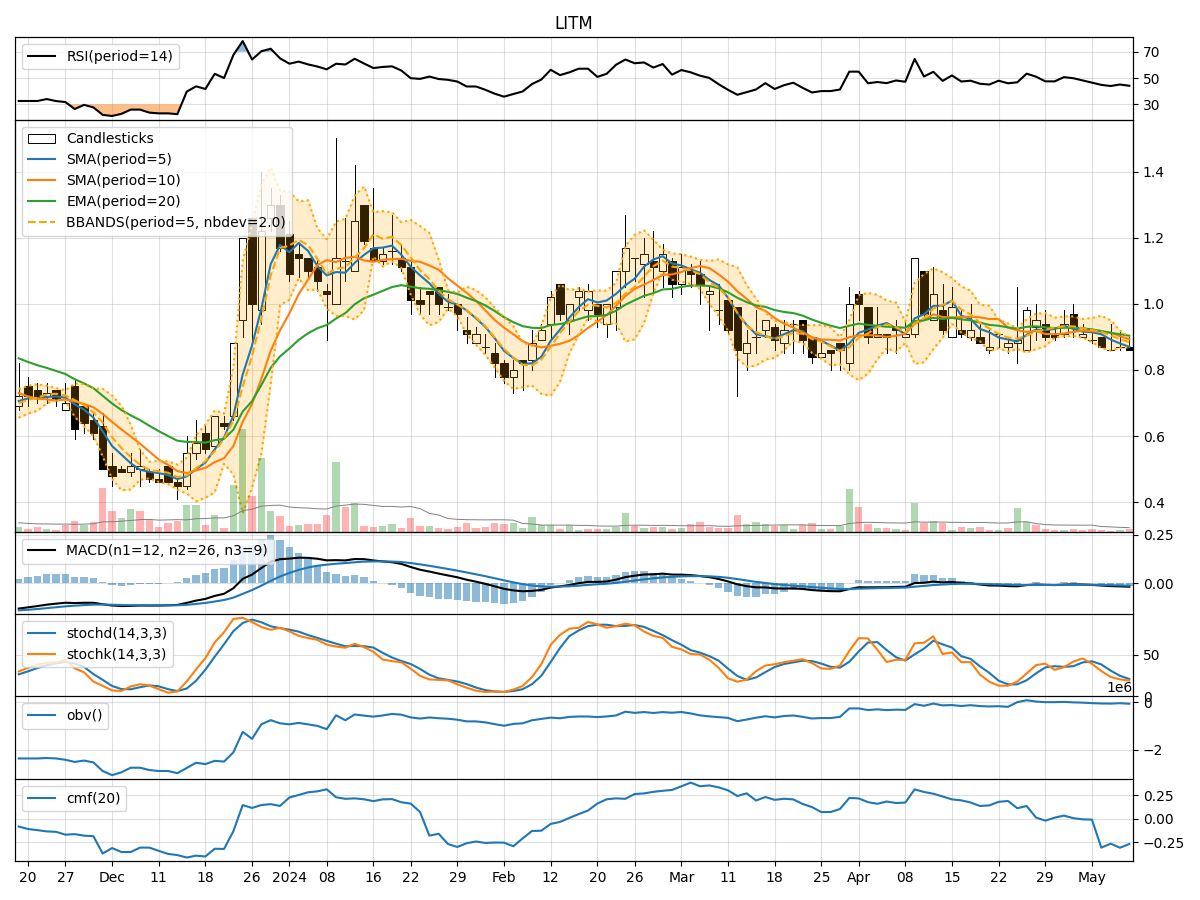
In analyzing the technical indicators for LITM over the last 5 days, we will delve into the trend, momentum, volatility, and volume indicators to provide a comprehensive outlook on the possible stock price movement. By examining these key aspects, we aim to offer valuable insights and predictions for the upcoming days.
Trend Analysis:
- Moving Averages (MA): The 5-day MA has been consistently below the closing prices, indicating a short-term downtrend.
- MACD: The MACD line has been decreasing, with the MACD histogram showing a negative trend, suggesting bearish momentum.
Key Observation: The trend indicators point towards a downward trajectory for LITM.
Momentum Analysis:
- RSI: The RSI values have been hovering around the mid-range, indicating a lack of strong momentum in either direction.
- Stochastic Oscillator: Both %K and %D values are low, reflecting a weak buying pressure.
Key Observation: Momentum indicators suggest a sideways movement with no clear direction.
Volatility Analysis:
- Bollinger Bands (BB): The bands have been narrowing, indicating decreasing volatility.
Key Observation: Volatility is decreasing, which may lead to a consolidation phase.
Volume Analysis:
- On-Balance Volume (OBV): The OBV has been fluctuating but not showing a clear trend.
- Chaikin Money Flow (CMF): The CMF values are negative, indicating selling pressure.
Key Observation: Volume indicators suggest uncertainty in market sentiment.
Conclusion:
Based on the analysis of trend, momentum, volatility, and volume indicators, the overall outlook for LITM in the next few days is bearish with a potential for sideways movement and consolidation. Traders should exercise caution and closely monitor key levels for potential entry or exit points. It is advisable to wait for clearer signals before making significant trading decisions.