Technical Analysis of LIVN 2024-05-10
Overview:
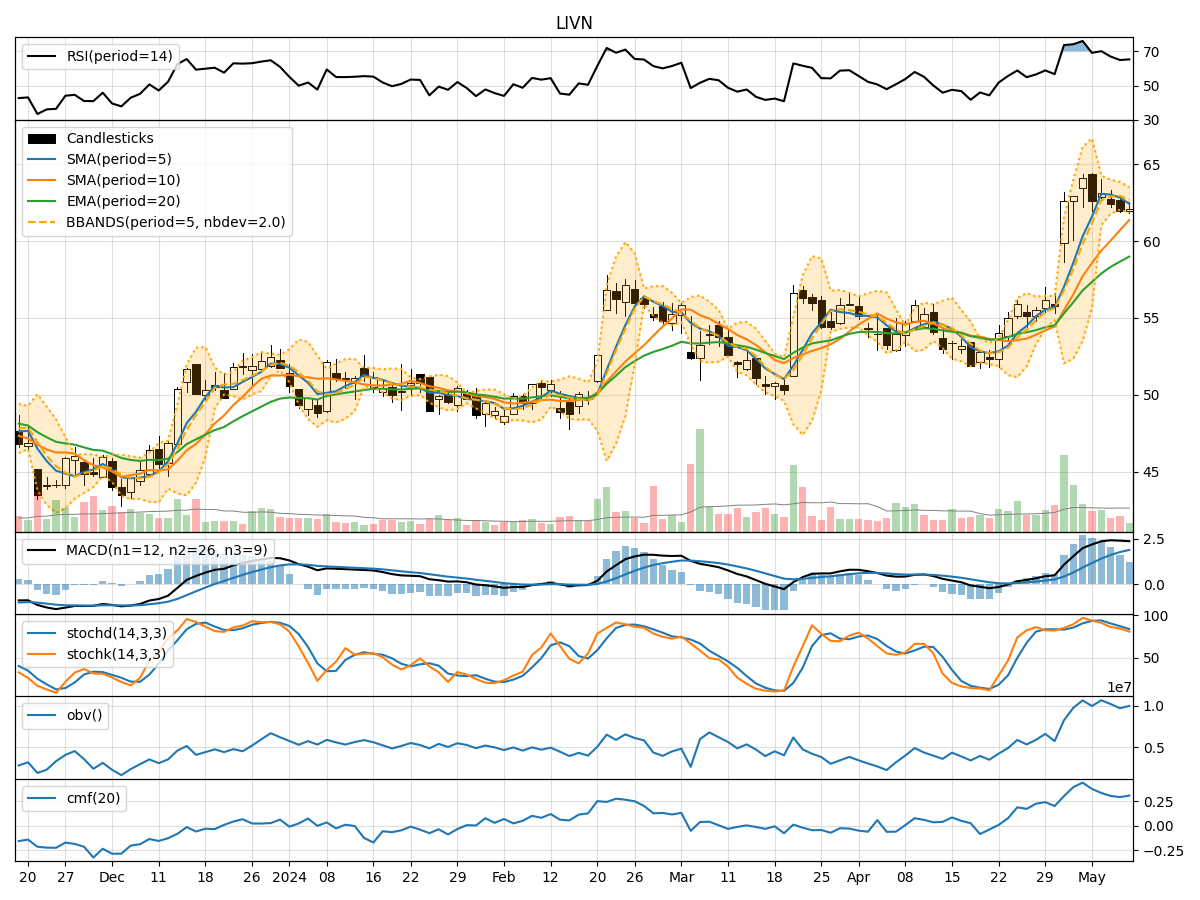
In analyzing the technical indicators for LIVN over the last 5 days, we will delve into the trend, momentum, volatility, and volume indicators to provide a comprehensive outlook on the possible stock price movement. By examining these key aspects, we aim to offer valuable insights and predictions for the upcoming days.
Trend Analysis:
- Moving Averages (MA): The 5-day Moving Average (MA) has been trending above the Simple Moving Average (SMA) and Exponential Moving Average (EMA), indicating a bullish trend.
- MACD: The MACD line has been consistently above the signal line, suggesting a bullish momentum in the stock price.
- RSI: The Relative Strength Index (RSI) has been fluctuating but generally staying above 50, indicating a bullish sentiment in the market.
Momentum Analysis:
- Stochastic Oscillator: The Stochastic Oscillator has been gradually decreasing but still remains in the overbought territory, signaling a potential reversal or consolidation.
- Williams %R: The Williams %R indicator has been in the oversold region, suggesting a possible buying opportunity in the near term.
Volatility Analysis:
- Bollinger Bands (BB): The Bollinger Bands have been narrowing, indicating decreasing volatility and a potential period of consolidation.
- Average True Range (ATR): The ATR has been relatively stable, suggesting a lack of significant price fluctuations.
Volume Analysis:
- On-Balance Volume (OBV): The OBV has shown mixed signals, reflecting indecision among investors regarding the stock.
- Chaikin Money Flow (CMF): The CMF has been positive, indicating that money is flowing into the stock despite some fluctuations.
Key Observations:
- The trend indicators suggest a bullish sentiment in the stock, supported by the MACD and RSI.
- Momentum indicators show a potential reversal or consolidation in the near term, as indicated by the Stochastic Oscillator and Williams %R.
- Volatility indicators point towards a period of consolidation with decreasing price fluctuations.
- Volume indicators reflect mixed signals, indicating uncertainty among investors.
Conclusion:
Based on the analysis of the technical indicators, the next few days for LIVN could see sideways movement or consolidation in the stock price. While the trend remains bullish, the momentum indicators suggest a possible reversal or consolidation. Volatility is expected to decrease, leading to a period of stability. Investors should closely monitor key support and resistance levels for potential entry or exit points.