Technical Analysis of LKCO 2024-05-10
Overview:
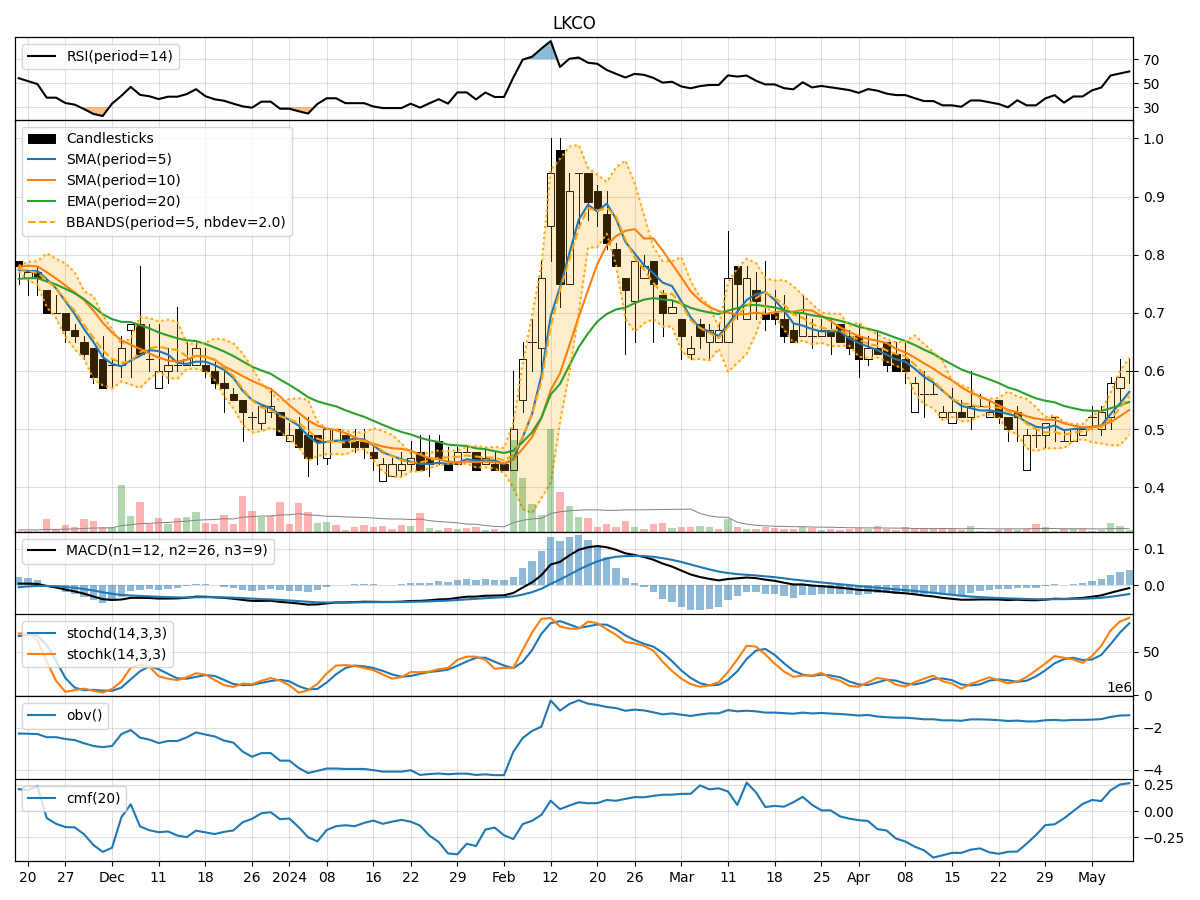
In the last 5 trading days, LKCO stock has shown a consistent upward trend in both price and volume. The moving averages have been steadily increasing, indicating a bullish momentum. Momentum indicators such as RSI, Stochastic Oscillator, and Williams %R are all pointing towards overbought conditions, suggesting a potential pullback. Volatility has also been increasing, as seen in the Bollinger Bands, indicating potential price fluctuations. Volume indicators show a positive trend, with On-Balance Volume (OBV) and Chaikin Money Flow (CMF) both on the rise.
Trend Indicators Analysis:
- Moving averages (MA) have been on an upward trajectory, indicating a bullish trend.
- MACD is positive but showing signs of convergence, which might signal a potential trend reversal.
- Overall, the trend indicators suggest an upward momentum in the stock price.
Momentum Indicators Analysis:
- RSI is in the overbought territory, indicating a potential reversal or correction.
- Stochastic Oscillator and Williams %R also suggest the stock is overbought.
- The momentum indicators collectively suggest a potential pullback or consolidation in the near future.
Volatility Indicators Analysis:
- Bollinger Bands have been widening, indicating increased volatility.
- The upper Bollinger Band has been breached, suggesting a potential reversal or correction.
- The volatility indicators point towards potential price fluctuations in the upcoming trading sessions.
Volume Indicators Analysis:
- OBV and CMF are both trending upwards, indicating buying pressure and positive money flow.
- Increasing volume supports the current uptrend in the stock price.
- Volume indicators suggest continued bullish sentiment in the market.
Conclusion:
Based on the analysis of the technical indicators, it is likely that LKCO stock will experience a short-term pullback or consolidation in the next few trading days. The overbought conditions indicated by momentum indicators and the potential trend reversal suggested by MACD convergence signal a possible correction in the stock price. However, the overall trend remains bullish, supported by the positive volume indicators and the upward trajectory of moving averages.
Key Conclusion: The stock is likely to experience a short-term correction before potentially resuming its upward trend. Traders should exercise caution and consider taking profits or implementing risk management strategies in anticipation of a pullback.