Technical Analysis of LLYVK 2024-05-10
Overview:
In analyzing the technical indicators for LLYVK over the last 5 days, we will delve into the trend, momentum, volatility, and volume indicators to provide a comprehensive outlook on the possible stock price movement. By examining these key indicators, we aim to offer valuable insights and predictions for the upcoming days.
Trend Analysis:
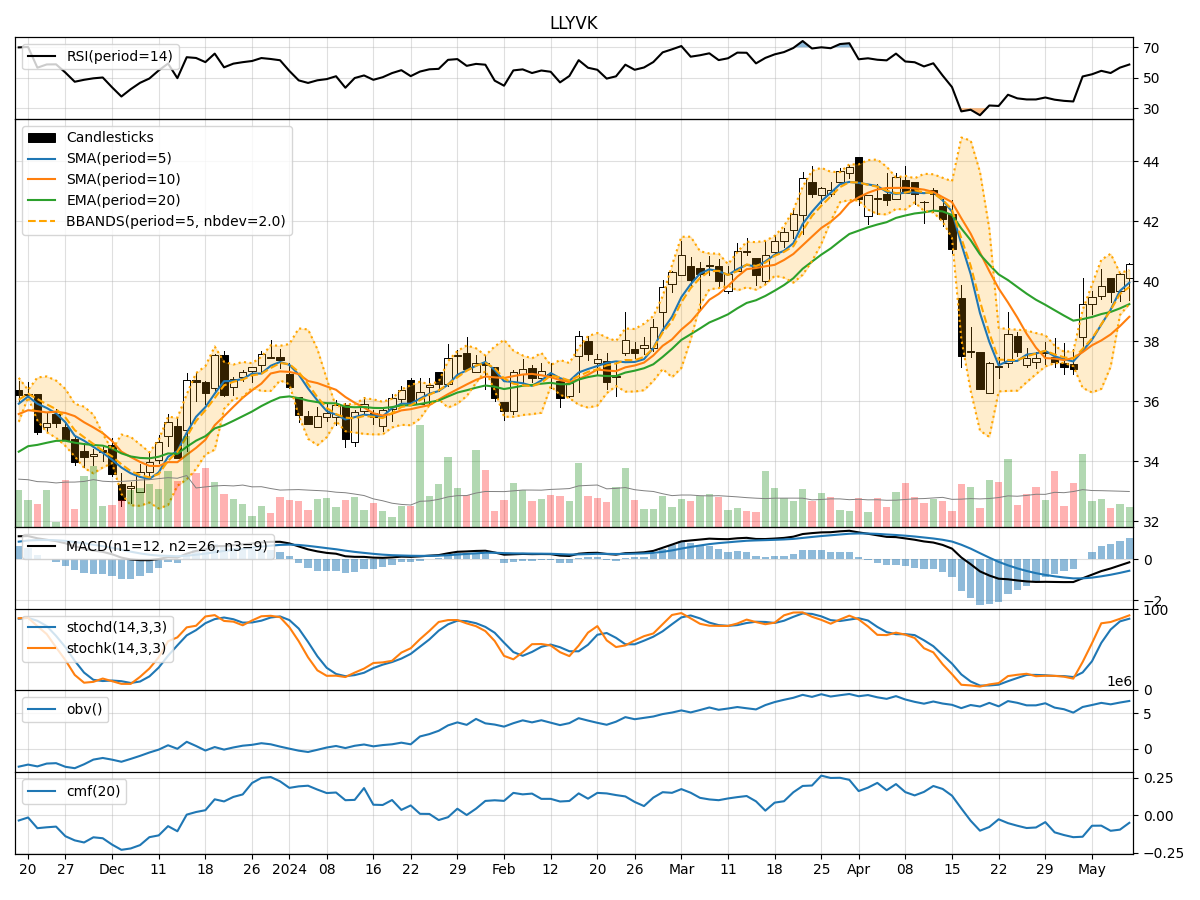
- Moving Averages (MA): The 5-day Moving Average (MA) has been consistently above the Simple Moving Average (SMA) and Exponential Moving Average (EMA), indicating a bullish trend.
- MACD: The MACD line has been below the signal line, but the gap is narrowing, suggesting a potential bullish crossover in the near future.
- Momentum: The momentum is positive, with the stock price consistently above the MA indicators, reflecting a strong bullish sentiment.
Momentum Analysis:
- RSI: The Relative Strength Index (RSI) has been trending upwards, indicating increasing buying pressure and potential overbought conditions.
- Stochastic Oscillator: Both %K and %D lines are in the overbought zone, suggesting a possible reversal or consolidation.
- Williams %R: The Williams %R is close to the oversold territory, indicating a potential buying opportunity.
Volatility Analysis:
- Bollinger Bands: The stock price has been trading within the Bollinger Bands, with the bands widening slightly, indicating increased volatility.
- Bollinger %B: The %B indicator is hovering around 0.8, suggesting the stock is trading near the upper band, potentially indicating an overbought condition.
Volume Analysis:
- On-Balance Volume (OBV): The OBV has been fluctuating but generally trending upwards, indicating accumulation by investors.
- Chaikin Money Flow (CMF): The CMF has been negative, suggesting some selling pressure in the stock.
Conclusion:
Based on the analysis of the technical indicators, the next few days' possible stock price movement for LLYVK is likely to experience a short-term pullback or consolidation. The bullish trend indicated by moving averages and momentum indicators may face resistance due to overbought conditions highlighted by the RSI and Stochastic Oscillator. The volatility in the Bollinger Bands and the negative CMF also support a potential correction in the stock price.
Key Conclusion: The stock is likely to experience a short-term downward correction before potentially resuming its bullish trend. Traders should exercise caution and consider taking profits or implementing risk management strategies in anticipation of a pullback.