Technical Analysis of LNT 2024-05-10
Overview:
In analyzing the technical indicators for LNT over the last 5 days, we will delve into the trend, momentum, volatility, and volume indicators to provide a comprehensive outlook on the possible stock price movement in the coming days. By examining these key aspects, we aim to offer valuable insights and predictions to guide investment decisions.
Trend Analysis:
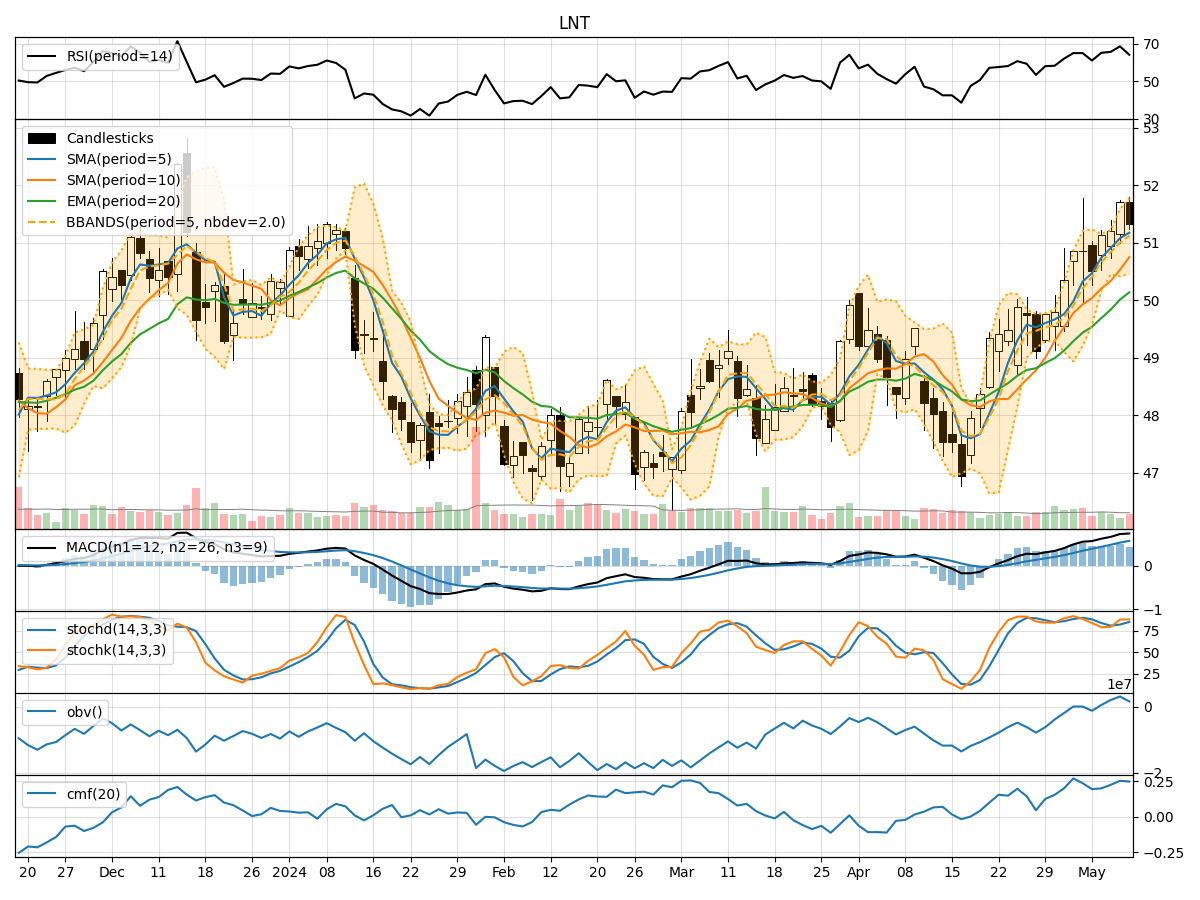
- Moving Averages (MA): The 5-day MA has been consistently above the 10-day SMA, indicating a short-term bullish trend. The EMA(20) has been steadily increasing, reflecting positive momentum.
- MACD: The MACD line has been above the signal line, with both lines showing an upward trend. The MACD histogram has been mostly positive, suggesting bullish momentum.
Momentum Analysis:
- RSI: The RSI has been in the overbought territory, indicating a strong bullish momentum in the stock.
- Stochastic Oscillator: Both %K and %D lines have been in the overbought zone, signaling a potential reversal or consolidation in the near future.
- Williams %R: The Williams %R has been fluctuating in the oversold and overbought zones, suggesting potential price reversals.
Volatility Analysis:
- Bollinger Bands (BB): The stock price has mostly remained within the Bollinger Bands, indicating moderate volatility. The bands have not shown any significant expansion or contraction.
- Bollinger %B: The %B indicator has been fluctuating around the midline, suggesting a balanced market sentiment.
Volume Analysis:
- On-Balance Volume (OBV): The OBV has shown a positive trend, indicating that volume has been higher on up days compared to down days.
- Chaikin Money Flow (CMF): The CMF has been positive, reflecting buying pressure in the stock.
Conclusion:
Based on the analysis of the technical indicators, the stock of LNT is currently in a bullish phase with strong momentum and positive volume trends. However, the overbought signals from the RSI and Stochastic Oscillator suggest a potential short-term consolidation or pullback in the stock price. Traders should be cautious of a possible correction in the coming days.
Considering the overall trend strength and momentum, the upward movement is likely to resume after a brief consolidation period. Investors with a long-term perspective can consider buying on dips to capitalize on the bullish trend. It is essential to monitor the price action closely and set appropriate stop-loss levels to manage risk effectively.
In conclusion, while the stock may experience some near-term volatility, the overall outlook remains bullish for LNT. Investors should stay vigilant and adapt their strategies based on evolving market conditions to make informed decisions.