Technical Analysis of LNTH 2024-05-10
Overview:
In analyzing the technical indicators for LNTH over the last 5 days, we will delve into the trend, momentum, volatility, and volume indicators to provide a comprehensive outlook on the possible stock price movement in the coming days. By examining these key indicators, we aim to offer valuable insights and predictions to guide investment decisions.
Trend Analysis:
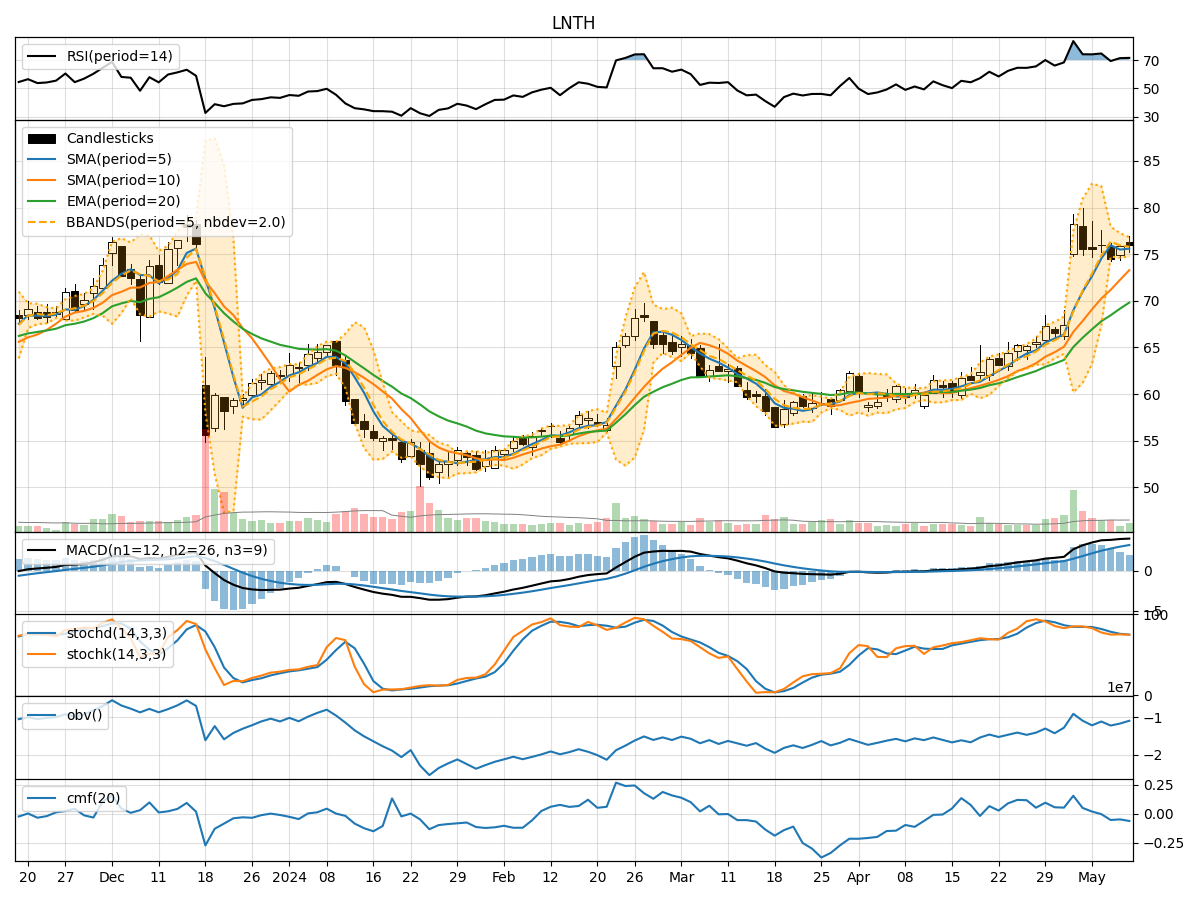
- Moving Averages (MA): The 5-day Moving Average (MA) has been consistently above the Simple Moving Average (SMA) and Exponential Moving Average (EMA), indicating a bullish trend.
- MACD: The MACD line has been above the signal line, with both lines showing an upward trend, suggesting bullish momentum.
- RSI: The Relative Strength Index (RSI) has been relatively high, indicating overbought conditions but also strong bullish momentum.
Momentum Analysis:
- Stochastic Oscillator: The Stochastic Oscillator has been fluctuating but generally staying in the overbought territory, signaling strong upward momentum.
- Williams %R: The Williams %R has been hovering around oversold levels, suggesting potential for a reversal in the short term.
Volatility Analysis:
- Bollinger Bands (BB): The Bollinger Bands have been narrowing, indicating decreasing volatility and a possible period of consolidation.
- BB %B: The %B indicator has been relatively stable, suggesting a lack of extreme price movements.
Volume Analysis:
- On-Balance Volume (OBV): The OBV has shown mixed signals, with fluctuations in volume but no clear trend.
- Chaikin Money Flow (CMF): The CMF has been negative, indicating selling pressure and potential bearish sentiment.
Key Observations:
- The trend indicators suggest a strong bullish sentiment, supported by moving averages and MACD.
- Momentum indicators show conflicting signals, with Stochastic Oscillator indicating strength and Williams %R hinting at a possible reversal.
- Volatility is decreasing, pointing towards a period of consolidation.
- Volume indicators are mixed, with OBV showing no clear trend and CMF indicating bearish sentiment.
Conclusion:
Based on the analysis of the technical indicators, the stock price of LNTH is likely to experience further upward movement in the coming days. The bullish trend supported by moving averages and MACD, along with decreasing volatility, suggests a potential for continued price appreciation. However, investors should remain cautious of the conflicting signals in momentum indicators and monitor volume trends closely for any shifts in market sentiment. Overall, the outlook for LNTH appears bullish in the short term.