Technical Analysis of LOGI 2024-05-10
Overview:
In analyzing the technical indicators for LOGI over the last 5 days, we will delve into the trend, momentum, volatility, and volume indicators to provide a comprehensive outlook on the possible stock price movement in the coming days. By examining these key aspects, we aim to offer valuable insights and predictions for potential investors.
Trend Indicators:
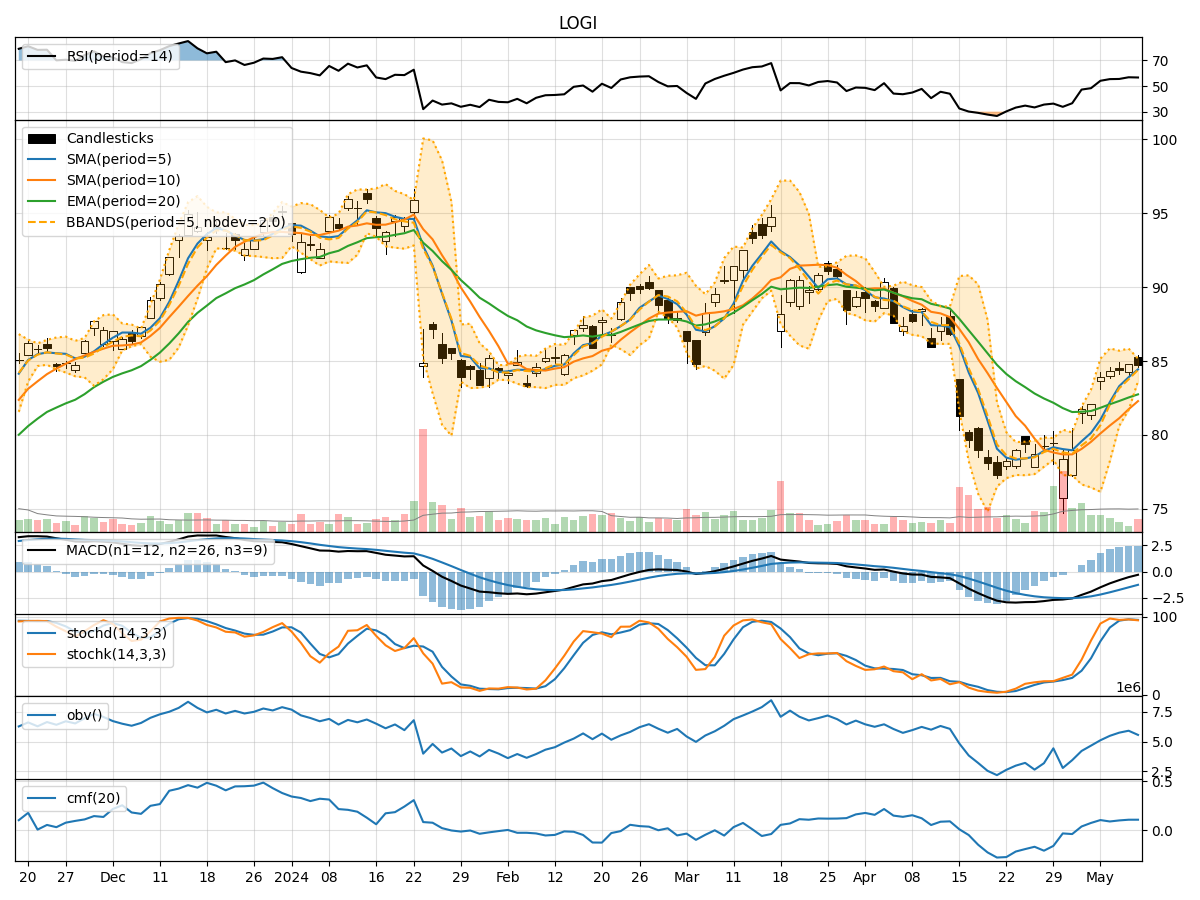
- Moving Averages (MA): The 5-day Moving Average has been consistently rising, indicating a bullish trend in the short term.
- MACD: The MACD line has been negative but converging towards the signal line, suggesting a potential bullish crossover.
- MACD Histogram: The histogram has been decreasing but is showing signs of stabilization.
Momentum Indicators:
- RSI: The Relative Strength Index has been fluctuating around the neutral zone, indicating indecision in the market.
- Stochastic Oscillator: Both %K and %D have been in the overbought territory, suggesting a possible reversal.
- Williams %R: The indicator has been in the oversold region, signaling a potential buying opportunity.
Volatility Indicators:
- Bollinger Bands: The stock price has been trading within the bands, indicating a period of consolidation.
- Bollinger %B: The %B indicator has been hovering around the middle range, reflecting a balanced market sentiment.
Volume Indicators:
- On-Balance Volume (OBV): The OBV has been increasing, suggesting accumulation by investors.
- Chaikin Money Flow (CMF): The CMF has been positive, indicating buying pressure in the market.
Key Observations:
- The trend indicators show a bullish bias in the short term.
- Momentum indicators suggest a mixed sentiment with potential for a reversal.
- Volatility indicators point towards a period of consolidation.
- Volume indicators indicate accumulation and positive buying pressure.
Conclusion:
Based on the analysis of the technical indicators, the next few days for LOGI stock price movement could see further upside potential in the short term. The bullish trend indicated by moving averages and the potential crossover in the MACD signal a positive outlook. However, caution is advised as momentum indicators show signs of indecision and possible reversal. The consolidation phase indicated by volatility indicators may lead to a period of sideways movement before a clear direction is established. Overall, a cautiously bullish view is recommended for the next few days.