Technical Analysis of LOPE 2024-05-10
Overview:
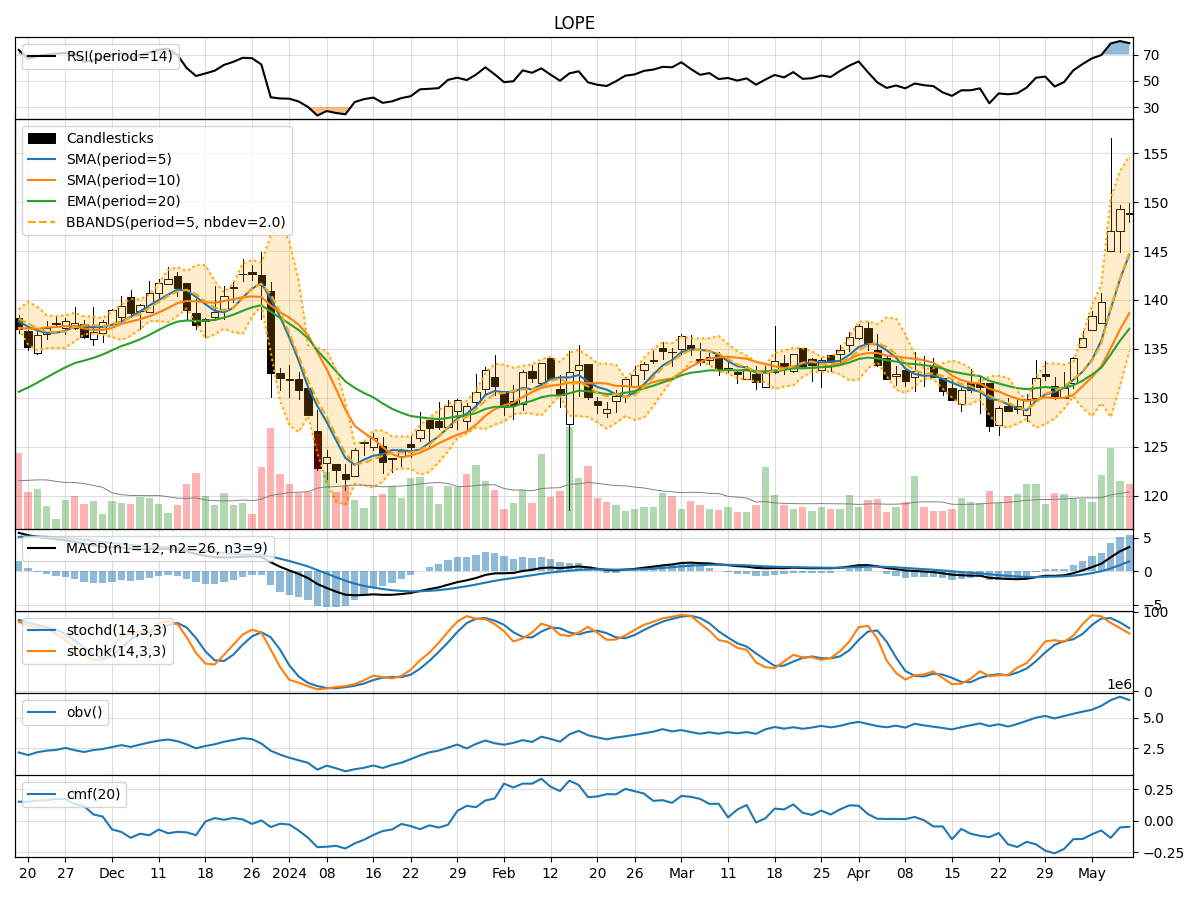
In analyzing the technical indicators for LOPE over the last 5 days, we will delve into the trend, momentum, volatility, and volume indicators to provide a comprehensive outlook on the possible stock price movement in the coming days.
Trend Analysis:
- Moving Averages (MA): The 5-day Moving Average has been consistently rising, indicating a bullish trend in the short term.
- MACD: The MACD line has been above the signal line for the past 5 days, suggesting a bullish momentum.
Momentum Analysis:
- RSI: The Relative Strength Index has been in the overbought territory, indicating a strong bullish momentum.
- Stochastic Oscillator: Both %K and %D have been decreasing, suggesting a potential reversal in momentum.
Volatility Analysis:
- Bollinger Bands (BB): The stock price has been trading above the upper Bollinger Band, indicating overbought conditions.
Volume Analysis:
- On-Balance Volume (OBV): The OBV has been increasing, suggesting accumulation by investors.
- Chaikin Money Flow (CMF): The CMF has been negative, indicating selling pressure.
Key Observations and Opinions:
- Trend: The trend indicators suggest a strong bullish sentiment in the short term.
- Momentum: While the RSI indicates overbought conditions, the Stochastic Oscillator signals a potential reversal.
- Volatility: The stock is currently overbought based on the Bollinger Bands.
- Volume: The OBV shows accumulation, but the CMF indicates selling pressure.
Conclusion:
Based on the analysis of the technical indicators, the next few days' possible stock price movement for LOPE is likely to experience a short-term correction or consolidation. The overbought conditions indicated by the RSI and Bollinger Bands, coupled with the potential reversal in momentum suggested by the Stochastic Oscillator, point towards a possible pullback in the stock price. Investors should exercise caution and consider taking profits or implementing risk management strategies in anticipation of a short-term downward movement.