Technical Analysis of LPRO 2024-05-31
Overview:
In analyzing the technical indicators for LPRO over the last 5 days, we will delve into the trend, momentum, volatility, and volume indicators to provide a comprehensive outlook on the possible stock price movement in the coming days. By examining these key aspects, we aim to offer valuable insights and predictions to guide your investment decisions.
Trend Analysis:
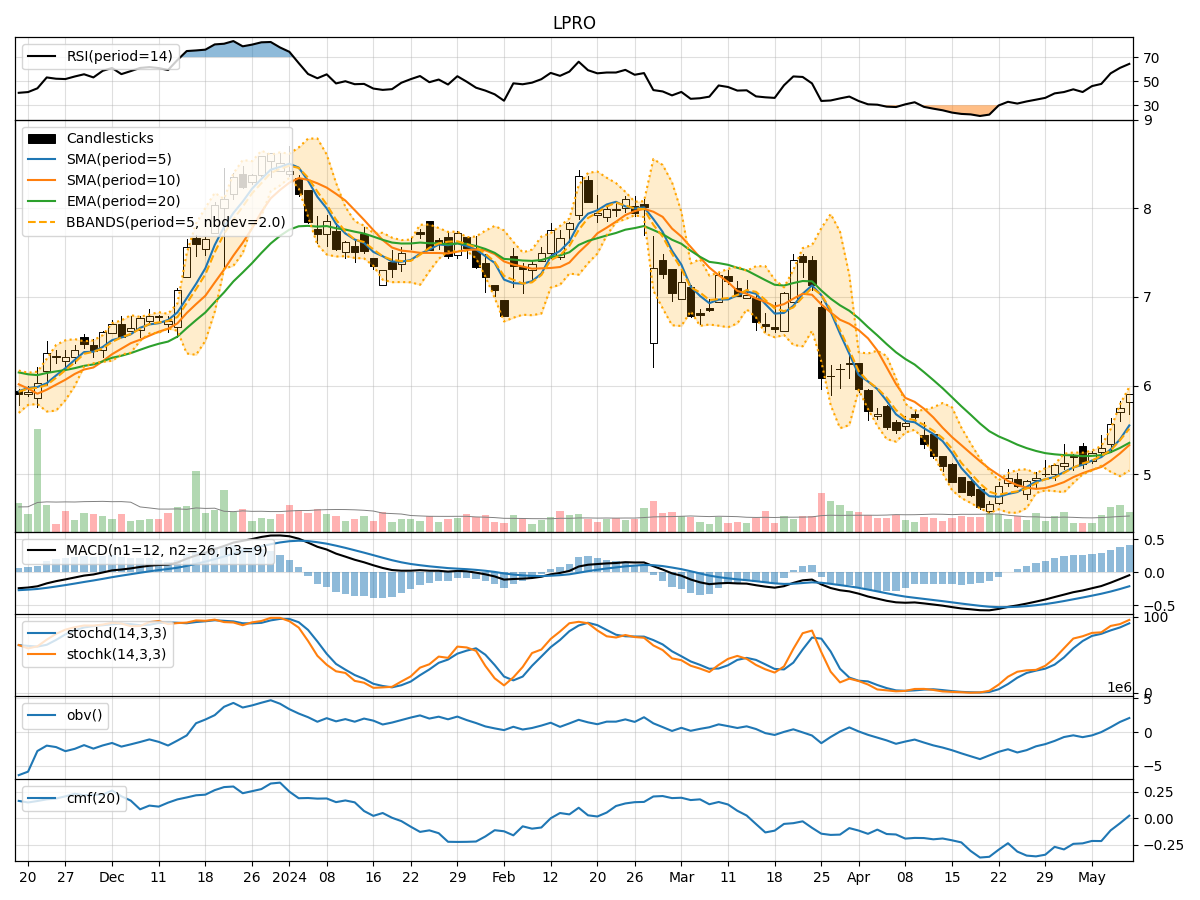
- Moving Averages (MA): The 5-day Moving Average (MA) has been fluctuating around the closing prices, indicating short-term price trends. The Simple Moving Average (SMA) and Exponential Moving Average (EMA) show an upward trend, suggesting a positive momentum.
- MACD: The MACD line has been consistently above the signal line, indicating a bullish trend. The MACD Histogram has also been increasing, further supporting the bullish sentiment.
Momentum Analysis:
- RSI: The Relative Strength Index (RSI) has been fluctuating but remains in the overbought territory, suggesting a potential reversal or consolidation in the near future.
- Stochastic Oscillator: Both %K and %D have been declining, indicating a potential bearish momentum. The Williams %R is also in the oversold region, signaling a possible reversal.
Volatility Analysis:
- Bollinger Bands (BB): The Bollinger Bands have been narrowing, indicating decreasing volatility. The bands are currently close to the moving average, suggesting a period of consolidation.
- Bollinger %B: The %B indicator is below 1, indicating that the price is below the lower band, potentially signaling an oversold condition.
Volume Analysis:
- On-Balance Volume (OBV): The OBV has been increasing, reflecting positive volume flow and potential accumulation by investors.
- Chaikin Money Flow (CMF): The CMF has been fluctuating but remains positive, indicating buying pressure in the market.
Conclusion:
Based on the analysis of the technical indicators, the stock price of LPRO is likely to experience a period of consolidation in the coming days. The trend indicators suggest a bullish bias, supported by the moving averages and MACD. However, the momentum indicators show signs of potential reversal with the RSI in the overbought region and stochastic oscillators pointing towards a bearish momentum.
Moreover, the volatility indicators indicate decreasing volatility and a potential period of consolidation, while the volume indicators suggest positive volume flow and buying pressure in the market.
Therefore, considering all the factors, it is recommended to exercise caution in trading LPRO in the short term. Traders may consider waiting for clearer signals or implementing risk management strategies to navigate the potential market uncertainties.