Technical Analysis of LRE 2024-05-10
Overview:
In analyzing the technical indicators for LRE over the last 5 days, we will delve into the trend, momentum, volatility, and volume indicators to provide a comprehensive outlook on the possible stock price movement in the coming days. By examining these key indicators, we aim to offer valuable insights and predictions for potential investors.
Trend Analysis:
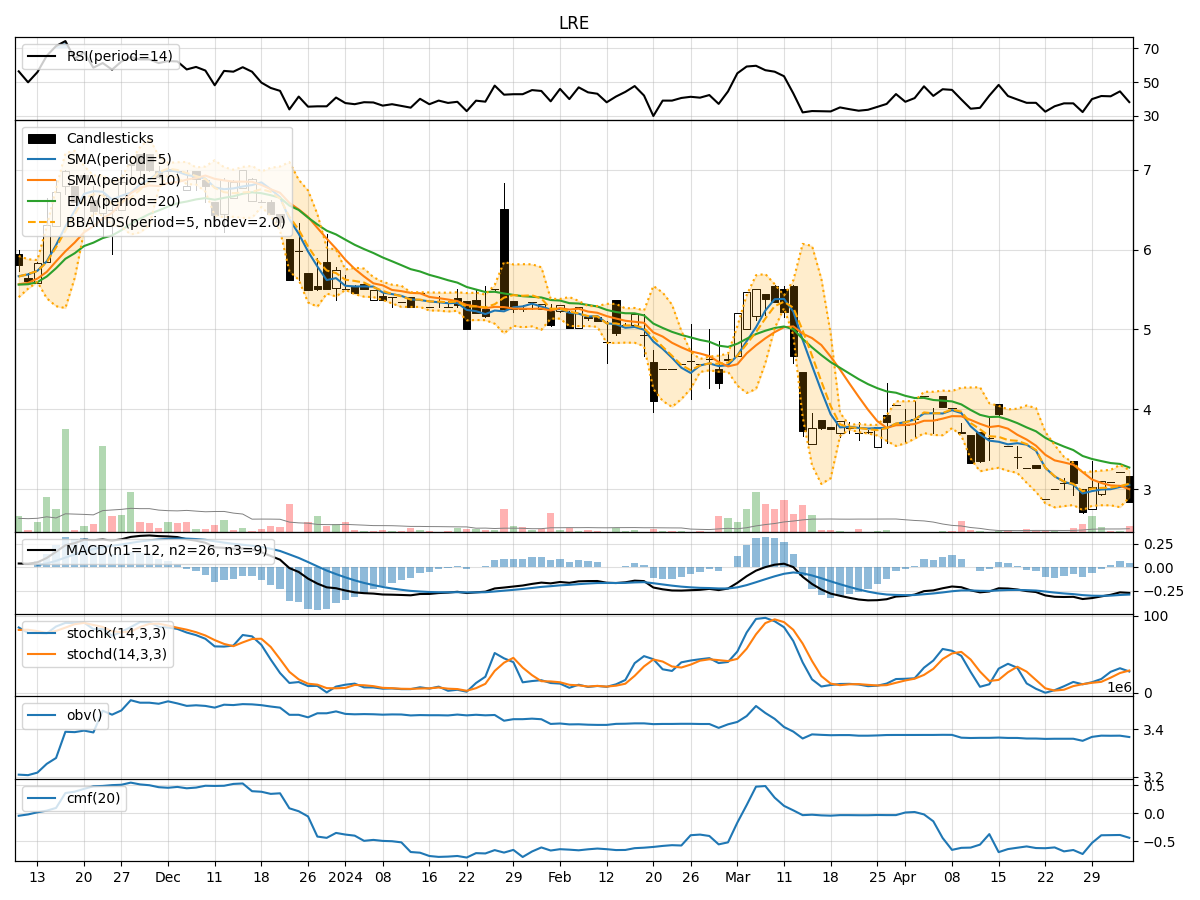
- Moving Averages (MA): The 5-day MA has been fluctuating around the closing prices, indicating short-term price trends. The SMA(10) and EMA(20) show a slight decline, suggesting a weakening trend.
- MACD: The MACD and Signal line have been negative, indicating a bearish trend. However, the MACD Histogram has shown some slight positive movements, hinting at a possible reversal.
Momentum Analysis:
- RSI: The RSI has been hovering around the mid-range, indicating a neutral momentum in the stock.
- Stochastic Oscillator: The Stochastics have been fluctuating in the overbought territory, suggesting a potential reversal or consolidation phase.
- Williams %R: The Williams %R is also in the oversold region, indicating a possible buying opportunity.
Volatility Analysis:
- Bollinger Bands (BB): The Bollinger Bands have been narrowing, indicating decreasing volatility in the stock price.
- Bollinger %B: The %B indicator has been fluctuating within a narrow range, suggesting a period of consolidation.
Volume Analysis:
- On-Balance Volume (OBV): The OBV has been relatively flat, indicating a balance between buying and selling pressure.
- Chaikin Money Flow (CMF): The CMF has been negative, suggesting a bearish money flow in the stock.
Key Observations:
- The trend indicators show a weakening trend with a potential for a reversal indicated by the MACD Histogram.
- Momentum indicators suggest a neutral to slightly bearish sentiment in the stock.
- Volatility indicators point towards decreasing volatility and a possible consolidation phase.
- Volume indicators reflect a balanced buying and selling pressure with a bearish money flow.
Conclusion:
Based on the analysis of the technical indicators, the stock price of LRE is likely to experience further consolidation in the coming days. The weakening trend, neutral to bearish momentum, decreasing volatility, and balanced volume suggest a period of sideways movement or a potential reversal. Investors should exercise caution and closely monitor key support and resistance levels for any potential breakout or trend reversal.
Recommendation:
- Short-term Traders: Consider staying on the sidelines or adopting a cautious approach until a clear trend emerges.
- Long-term Investors: Monitor the stock closely for potential entry points during consolidation phases or trend reversals.
- Risk Management: Implement stop-loss orders to protect against unexpected price movements.
In conclusion, the overall outlook for LRE indicates a sideways movement with a potential for a reversal based on the technical indicators analyzed.