Technical Analysis of LSAK 2024-05-10
Overview:
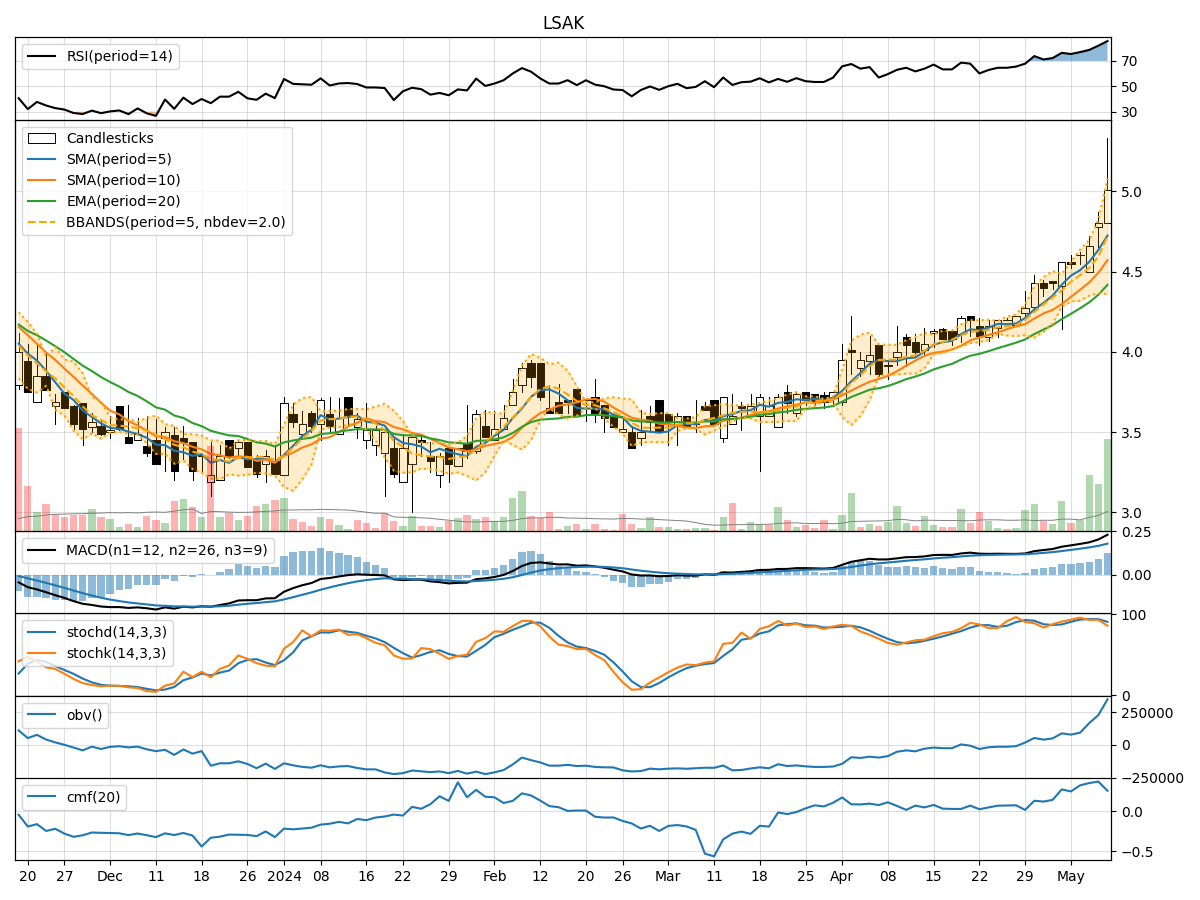
In analyzing the technical indicators for LSAK stock over the last 5 days, we will delve into the trends, momentum, volatility, and volume aspects to provide a comprehensive outlook on the possible stock price movement in the upcoming days. By examining key indicators such as moving averages, MACD, RSI, Bollinger Bands, and OBV, we aim to offer valuable insights and predictions for informed decision-making.
Trend Analysis:
- Moving Averages (MA): The 5-day moving average has been consistently rising, indicating a bullish trend in the short term.
- MACD: The MACD line has been increasing, with the MACD histogram also showing an upward trend, suggesting bullish momentum.
Momentum Analysis:
- RSI: The RSI has been steadily increasing and is currently in the overbought territory, signaling a strong bullish momentum.
- Stochastic Oscillator: Both %K and %D lines are relatively high, indicating an overbought condition.
Volatility Analysis:
- Bollinger Bands: The stock price has been consistently trading above the upper Bollinger Band, suggesting an overbought condition and potential for a pullback.
Volume Analysis:
- On-Balance Volume (OBV): The OBV indicator has been steadily increasing, reflecting strong buying pressure.
Key Observations:
- The stock is exhibiting strong bullish momentum based on RSI and MACD indicators.
- The price has deviated significantly from the upper Bollinger Band, indicating a potential reversal or correction.
- The increasing OBV suggests growing accumulation by investors.
Conclusion:
Based on the technical analysis of the trend, momentum, volatility, and volume indicators, the stock is currently in an overbought condition and may experience a short-term pullback or consolidation. Traders should exercise caution and consider taking profits or implementing risk management strategies. The bullish momentum may continue in the medium to long term, but a correction in the near future is likely. It is advisable to monitor the price action closely for signs of a reversal or continuation of the current trend.