Technical Analysis of LSDI 2024-05-10
Overview:
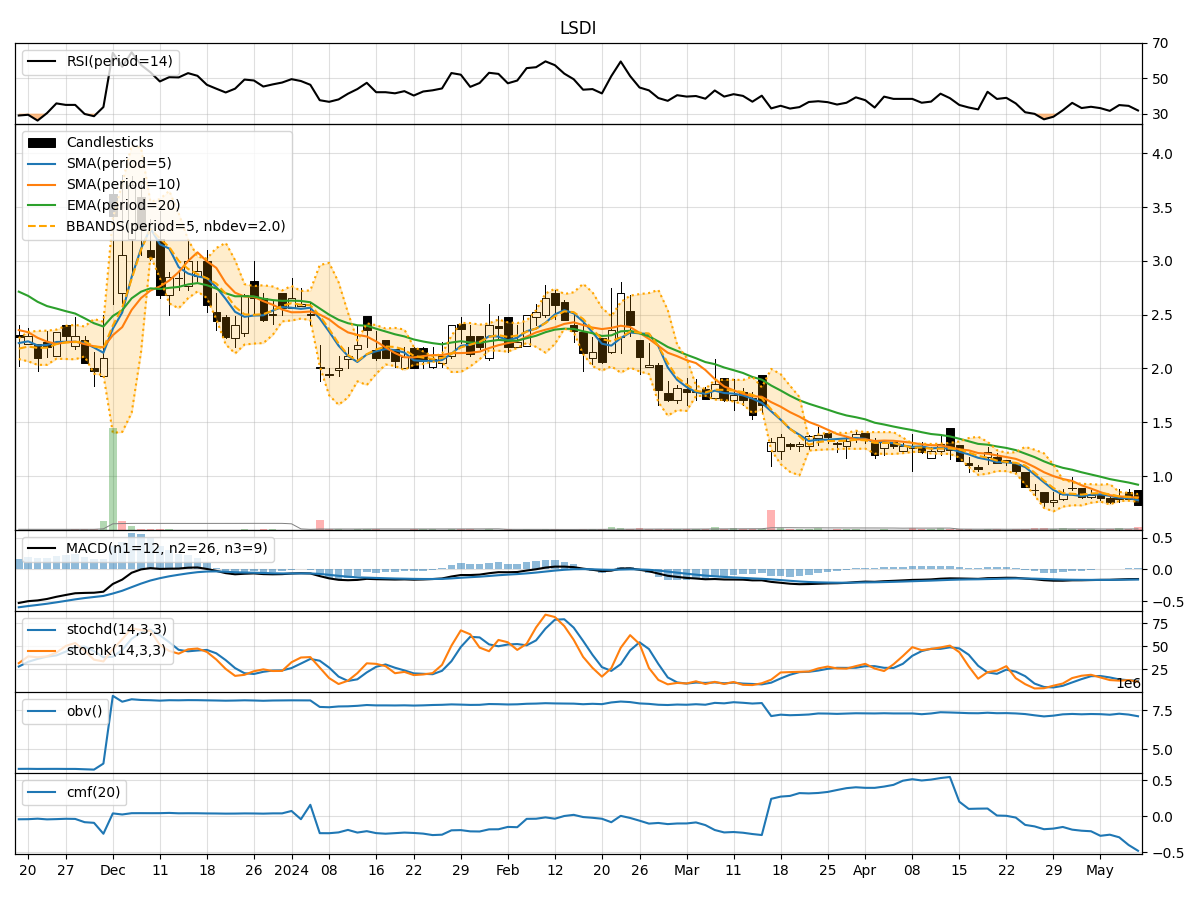
In the last 5 trading days, the stock price of LSDI has shown some volatility with fluctuations in both price and volume. The trend indicators suggest a downward trend, with moving averages and MACD signaling a bearish sentiment. Momentum indicators also indicate a bearish momentum, while volatility indicators show fluctuating price movements. Volume indicators reflect a negative trend in volume accumulation.
Trend Analysis:
- Moving Averages (MA): The 5-day moving average has been consistently below the longer-term moving averages, indicating a downward trend.
- MACD: The MACD line has been below the signal line, further confirming the bearish sentiment in the stock price movement.
Momentum Analysis:
- RSI: The RSI values have been below 50, indicating a bearish momentum in the stock.
- Stochastic Oscillator: Both %K and %D values have been decreasing, suggesting a bearish momentum.
Volatility Analysis:
- Bollinger Bands: The Bollinger Bands have shown widening in volatility, indicating increased price fluctuations.
- Bollinger %B: The %B values have been fluctuating, reflecting the volatile nature of the stock price.
Volume Analysis:
- On-Balance Volume (OBV): The OBV values have been consistently negative, indicating a lack of volume accumulation.
- Chaikin Money Flow (CMF): The CMF values have been negative, suggesting a bearish trend in the stock.
Key Observations:
- The stock is currently in a downtrend based on the moving averages and MACD indicators.
- Momentum indicators like RSI and Stochastic Oscillator confirm the bearish sentiment in the stock price movement.
- Volatility indicators show increased price fluctuations, which may lead to unpredictable movements.
- Volume indicators reflect a lack of buying interest and negative volume accumulation.
Conclusion:
Based on the analysis of the technical indicators, the next few days' possible stock price movement for LSDI is likely to be downward. The overall trend, momentum, volatility, and volume indicators all point towards a bearish outlook. Investors should exercise caution and consider waiting for more positive signals before considering any long positions.