Technical Analysis of LSTR 2024-05-10
Overview:
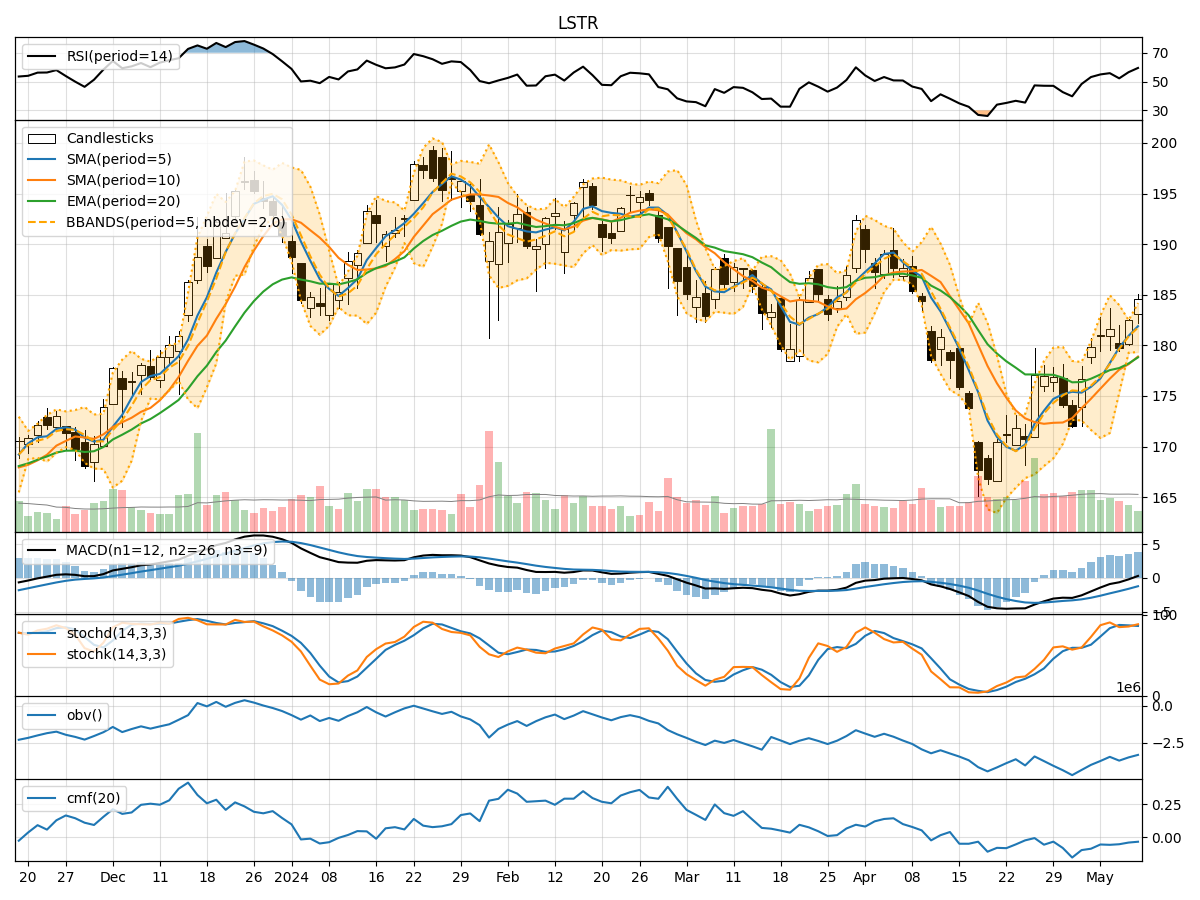
In analyzing the technical indicators for LSTR over the last 5 days, we will delve into the trend, momentum, volatility, and volume indicators to provide a comprehensive outlook on the possible stock price movement in the coming days.
Trend Analysis:
- Moving Averages (MA): The 5-day Moving Average (MA) has been consistently above the Simple Moving Average (SMA) and Exponential Moving Average (EMA), indicating a bullish trend.
- MACD: The MACD line has been consistently above the signal line, suggesting a bullish momentum in the stock price.
- Conclusion: The trend indicators point towards an upward trend in the stock price.
Momentum Analysis:
- RSI: The Relative Strength Index (RSI) has been fluctuating around the 50 level, indicating a neutral momentum.
- Stochastic Oscillator: Both %K and %D have been hovering around the overbought zone, suggesting a potential reversal.
- Conclusion: The momentum indicators suggest a neutral to slightly bearish momentum in the stock price.
Volatility Analysis:
- Bollinger Bands (BB): The stock price has been trading within the Bollinger Bands, with the bands narrowing, indicating decreasing volatility.
- Conclusion: The volatility indicators signal a decreasing volatility in the stock price.
Volume Analysis:
- On-Balance Volume (OBV): The OBV has been fluctuating, indicating a balance between buying and selling pressure.
- Chaikin Money Flow (CMF): The CMF has been negative, suggesting a bearish money flow.
- Conclusion: The volume indicators imply a neutral to slightly bearish sentiment in the stock.
Overall Conclusion:
- Considering the trend indicators pointing towards an upward trend, the momentum indicators suggesting a neutral to slightly bearish momentum, the decreasing volatility, and the volume indicators indicating a neutral to slightly bearish sentiment, the overall outlook for LSTR in the next few days is mixed.
- Traders should exercise caution and closely monitor key levels such as support and resistance to make informed trading decisions.
- It is advisable to wait for further confirmation from the market before taking significant positions.
- Key Conclusion: The stock price of LSTR is likely to experience sideways consolidation in the next few days, with a potential for a slight downward bias based on the momentum and volume indicators.
By carefully considering these technical indicators and their implications, traders can better navigate the market dynamics and make informed decisions aligned with their risk tolerance and investment objectives.