Technical Analysis of LSXMA 2024-05-10
Overview:
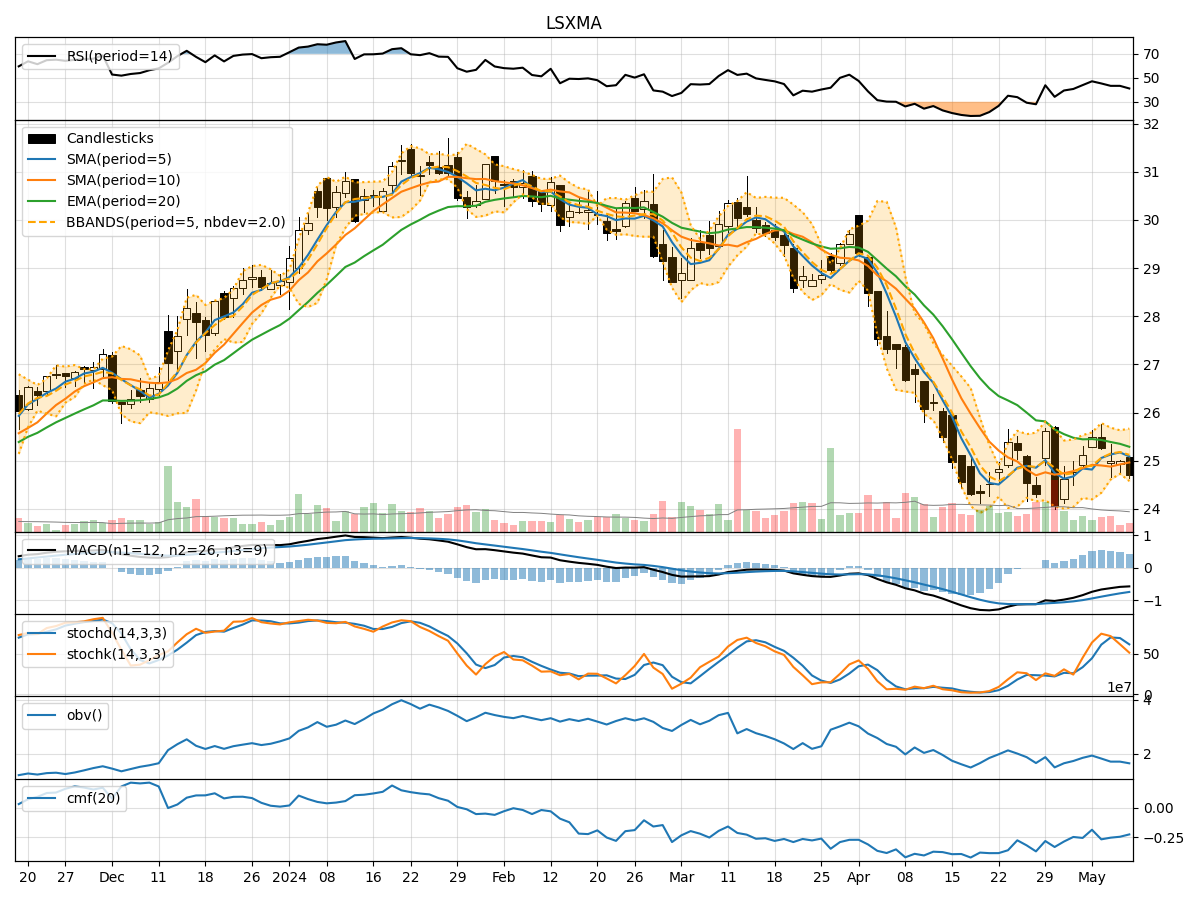
In analyzing the technical indicators for LSXMA over the last 5 days, we will delve into the trend, momentum, volatility, and volume indicators to provide a comprehensive outlook on the possible stock price movement. By examining these key aspects, we aim to offer valuable insights and predictions for the upcoming days.
Trend Analysis:
- Moving Averages (MA): The 5-day Moving Average (MA) has been fluctuating around the closing prices, indicating a short-term trend. The Simple Moving Average (SMA) and Exponential Moving Average (EMA) show a slight downtrend, with the EMA lagging behind.
- MACD: The Moving Average Convergence Divergence (MACD) has been negative, suggesting a bearish momentum in the stock price.
- MACD Histogram: The MACD Histogram has been decreasing, indicating a weakening bearish momentum.
Momentum Analysis:
- RSI: The Relative Strength Index (RSI) has been declining, currently in the neutral zone, suggesting a lack of strong momentum in either direction.
- Stochastic Oscillator: Both %K and %D of the Stochastic Oscillator have been decreasing, indicating a bearish momentum.
- Williams %R: The Williams %R is in the oversold territory, signaling a potential reversal or consolidation.
Volatility Analysis:
- Bollinger Bands (BB): The Bollinger Bands have been narrowing, indicating decreasing volatility in the stock price.
- Bollinger %B: The %B indicator is low, suggesting the stock price is closer to the lower band, potentially indicating an oversold condition.
Volume Analysis:
- On-Balance Volume (OBV): The OBV has been declining, indicating selling pressure in the stock.
- Chaikin Money Flow (CMF): The CMF has been negative, reflecting a lack of buying interest in the stock.
Conclusion:
Based on the analysis of the technical indicators, the stock of LSXMA is currently in a bearish phase. The trend indicators show a downtrend, supported by the negative MACD and decreasing moving averages. Momentum indicators also confirm the bearish sentiment, with RSI and Stochastic Oscillator pointing downwards. Volatility is decreasing, suggesting a potential consolidation phase. The volume indicators further support the bearish view, with OBV showing selling pressure and CMF indicating a lack of buying interest.
Forecast:
Considering the overall bearish outlook and the lack of strong positive signals in the technical indicators, it is likely that LSXMA will continue its downward trajectory in the next few days. Traders and investors should exercise caution and consider shorting or staying on the sidelines until clearer bullish signals emerge in the technical analysis.