Technical Analysis of LSXMK 2024-05-10
Overview:
In analyzing the technical indicators for LSXMK over the last 5 days, we will delve into the trend, momentum, volatility, and volume indicators to provide a comprehensive outlook on the possible stock price movement in the coming days. By examining these key indicators, we aim to offer valuable insights and predictions for potential investors.
Trend Analysis:
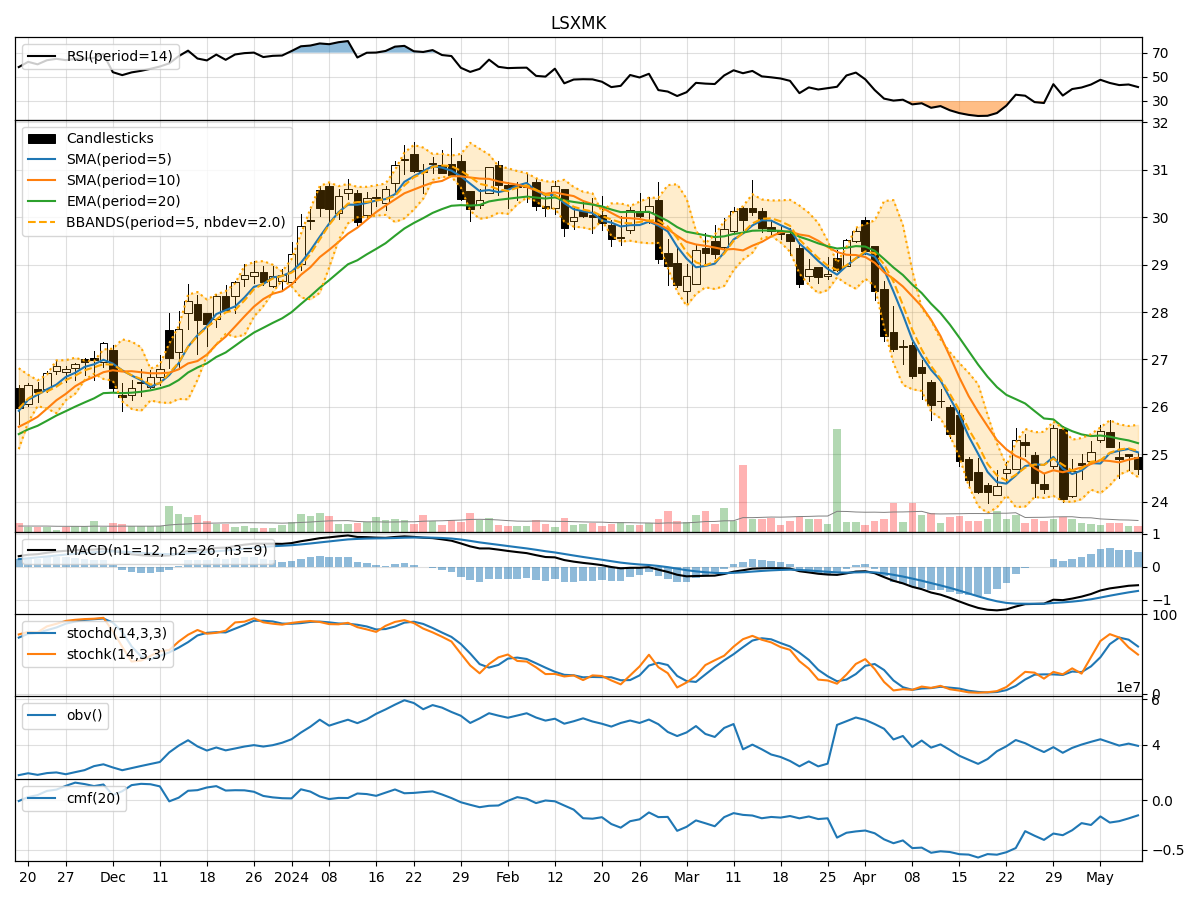
- Moving Averages (MA): The 5-day Moving Average (MA) has been fluctuating around the closing prices, indicating short-term price trends. The Simple Moving Average (SMA) and Exponential Moving Average (EMA) show a downward trend, suggesting a bearish sentiment.
- MACD: The Moving Average Convergence Divergence (MACD) has been negative, with the MACD line consistently below the signal line. This indicates a bearish momentum in the stock price.
- Conclusion: The trend indicators suggest a bearish outlook for LSXMK in the near term.
Momentum Analysis:
- RSI: The Relative Strength Index (RSI) has been hovering around the 40-50 range, indicating a neutral momentum with a slight bearish bias.
- Stochastic Oscillator: Both %K and %D have been declining, moving towards the oversold territory. This signals a weakening momentum in the stock.
- Conclusion: The momentum indicators suggest a bearish sentiment with a potential for further downside movement.
Volatility Analysis:
- Bollinger Bands: The Bollinger Bands show a narrowing range, indicating decreasing volatility in the stock price. The bands are contracting, suggesting a period of consolidation.
- Conclusion: The volatility indicators point towards a sideways movement or consolidation phase for LSXMK in the upcoming days.
Volume Analysis:
- On-Balance Volume (OBV): The OBV has been consistently negative, indicating a higher selling volume compared to buying volume over the past 5 days.
- Chaikin Money Flow (CMF): The CMF has been negative, reflecting a bearish money flow trend in the stock.
- Conclusion: The volume indicators suggest a bearish sentiment with higher selling pressure.
Overall Conclusion:
Based on the analysis of trend, momentum, volatility, and volume indicators, the overall outlook for LSXMK in the next few days is bearish. The trend indicators, momentum oscillators, and volume indicators all point towards a potential downward movement in the stock price. The volatility indicators suggest a period of consolidation, possibly before a further decline.
Recommendation:
Considering the bearish signals across multiple technical indicators, it is advisable to exercise caution when considering investments in LSXMK. Traders may look for short-selling opportunities or wait for a clearer trend reversal signal before considering long positions. It is essential to closely monitor the price action and key support levels to validate the predicted downward movement.
Disclaimer:
Please note that technical analysis is not a guaranteed predictor of future price movements, and market dynamics can change rapidly. It is crucial to conduct thorough research, consider fundamental factors, and consult with financial advisors before making any investment decisions.