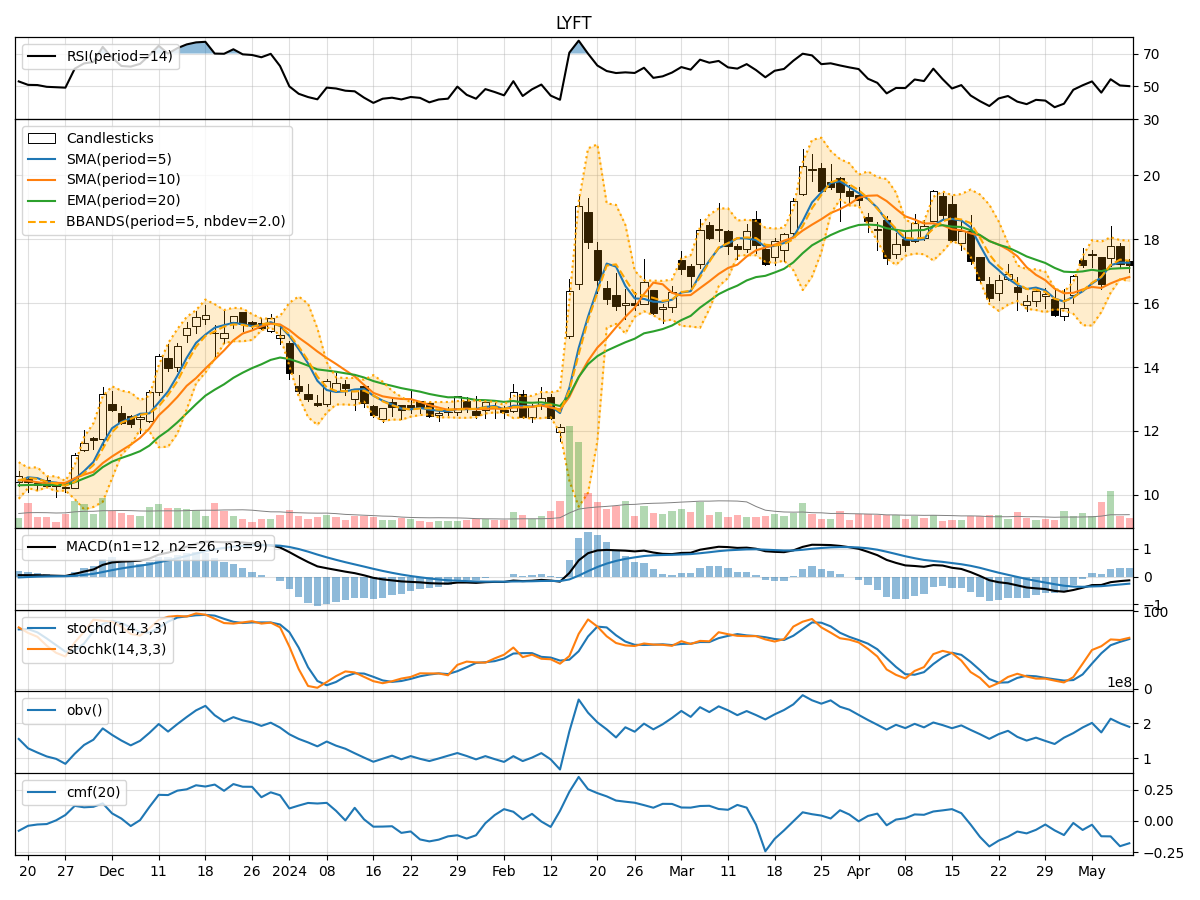
Technical Analysis of LYFT 2024-05-10
Overview:
In analyzing the technical indicators for LYFT over the last 5 days, we will delve into the trend, momentum, volatility, and volume indicators to provide a comprehensive outlook on the possible stock price movement. By examining these key aspects, we aim to offer valuable insights and predictions for the upcoming days.
Trend Analysis:
- Moving Averages (MA): The 5-day Moving Average (MA) has been fluctuating around the closing prices, indicating short-term price trends. The Simple Moving Average (SMA) and Exponential Moving Average (EMA) show a slight upward trend, suggesting potential bullish momentum.
- MACD: The Moving Average Convergence Divergence (MACD) has been negative but showing signs of convergence towards the signal line, hinting at a possible trend reversal.
- Conclusion: The trend indicators suggest a potential bullish reversal in the short term.
Momentum Analysis:
- RSI: The Relative Strength Index (RSI) has been hovering around the neutral zone, indicating a balanced momentum between buying and selling pressure.
- Stochastic Oscillator: Both %K and %D have been in the overbought territory, suggesting a potential pullback in price.
- Conclusion: The momentum indicators imply a neutral to slightly bearish sentiment in the near future.
Volatility Analysis:
- Bollinger Bands (BB): The Bollinger Bands are narrowing, indicating decreasing volatility and a possible period of consolidation.
- Conclusion: The volatility indicators point towards a consolidation phase with reduced price fluctuations.
Volume Analysis:
- On-Balance Volume (OBV): The OBV has been fluctuating, indicating indecision among market participants.
- Chaikin Money Flow (CMF): The CMF has been negative, suggesting outflow of money from the stock.
- Conclusion: The volume indicators reflect uncertainty and potential selling pressure in the market.
Overall Conclusion:
Based on the analysis of trend, momentum, volatility, and volume indicators, the next few days may see LYFT stock price experiencing a bullish reversal in the short term. However, the momentum indicators suggest a neutral to slightly bearish sentiment, indicating a possible pullback before a potential uptrend. The volatility indicators point towards a consolidation phase with reduced price fluctuations, while the volume indicators reflect uncertainty and selling pressure.
Key Recommendations:
- Monitor Price Action: Keep a close eye on price movements for confirmation of the bullish reversal.
- Watch Momentum Indicators: Look for signs of a potential pullback in price before considering entry points.
- Stay Cautious: Given the uncertainty in volume indicators, exercise caution and consider risk management strategies.
In conclusion, while the technical indicators suggest a bullish reversal in the short term for LYFT, it is essential to remain vigilant and adapt to changing market conditions. Conducting further analysis and staying informed will be crucial in making well-informed trading decisions.