Technical Analysis of LYTS 2024-05-10
Overview:
In analyzing the technical indicators for LYTS over the last 5 days, we will delve into the trend, momentum, volatility, and volume indicators to provide a comprehensive outlook on the possible stock price movement. By examining these key aspects, we aim to offer valuable insights and predictions for the upcoming days.
Trend Analysis:
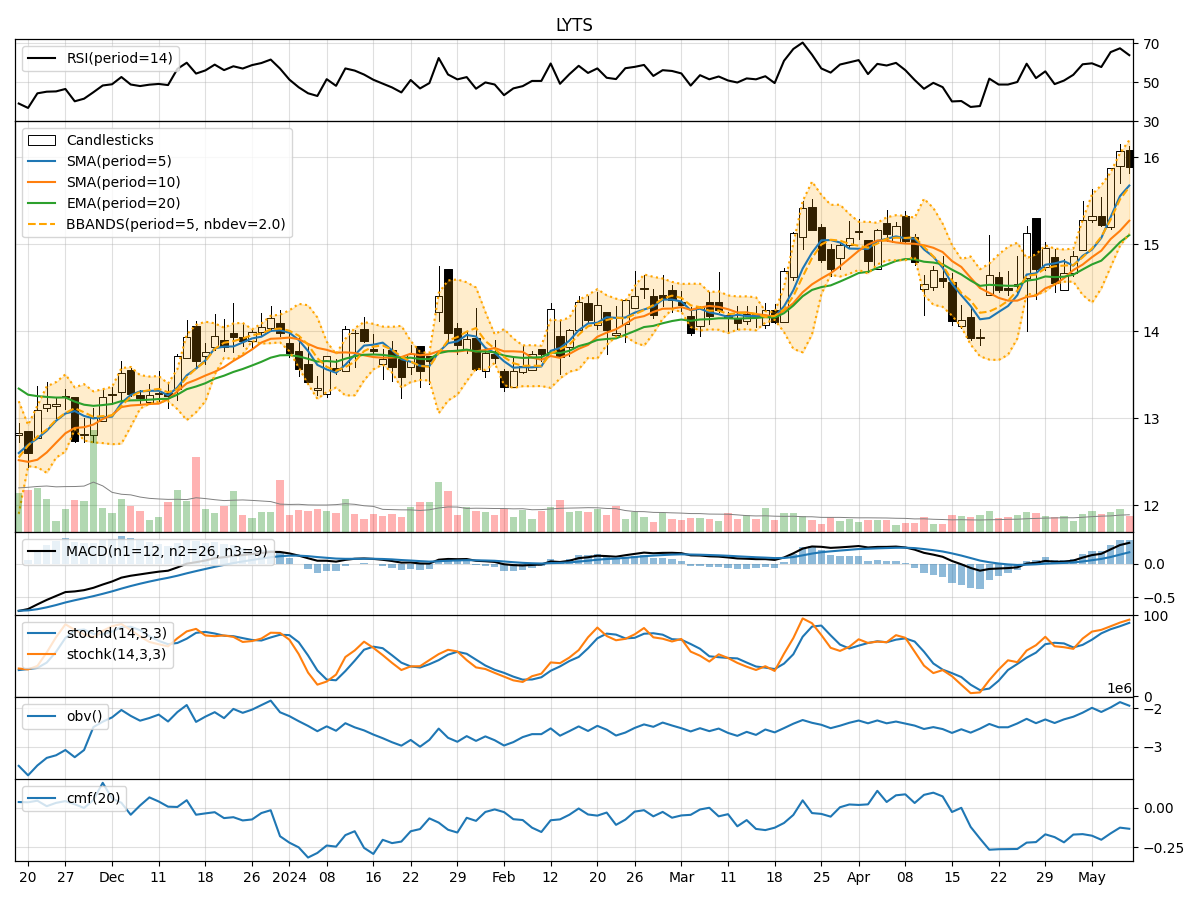
- Moving Averages (MA): The 5-day Moving Average (MA) has been showing an upward trend, indicating a positive momentum in the stock price.
- MACD: The Moving Average Convergence Divergence (MACD) has been consistently increasing, suggesting a strengthening bullish momentum.
- EMA: The Exponential Moving Average (EMA) has been on the rise, supporting the bullish sentiment in the short to medium term.
Key Observation: The trend indicators point towards a bullish outlook for LYTS in the near future.
Momentum Analysis:
- RSI: The Relative Strength Index (RSI) has been hovering around the neutral zone, indicating a balanced momentum in the stock.
- Stochastic Oscillator: Both %K and %D values have been in the overbought territory, suggesting a potential reversal or consolidation.
- Williams %R: The Williams %R is in the oversold region, signaling a possible buying opportunity.
Key Observation: The momentum indicators reflect a mixed sentiment, with a slight bias towards a bearish reversal.
Volatility Analysis:
- Bollinger Bands: The Bollinger Bands are widening, indicating increased volatility in the stock price.
- Bollinger %B: The %B value is fluctuating within a moderate range, suggesting potential price swings.
- Average True Range (ATR): The ATR is showing an uptick, signaling rising volatility levels.
Key Observation: Volatility indicators point towards an increased level of volatility in the upcoming trading sessions.
Volume Analysis:
- On-Balance Volume (OBV): The OBV has been fluctuating, indicating indecision among market participants.
- Chaikin Money Flow (CMF): The CMF is negative, suggesting a net outflow of money from the stock.
Key Observation: Volume indicators suggest a neutral stance with a slight inclination towards bearish sentiment.
Conclusion:
Based on the analysis of trend, momentum, volatility, and volume indicators, the overall outlook for LYTS in the next few days is as follows:
- Trend: Upward
- Momentum: Mixed with a Bearish Bias
- Volatility: Increased
- Volume: Neutral to Bearish
Final Verdict:
Considering the comprehensive analysis of technical indicators, the next few days for LYTS are likely to witness upward price movement with increased volatility and a mixed momentum outlook. Traders should exercise caution and closely monitor key support and resistance levels for potential trading opportunities.