Technical Analysis of MASI 2024-05-10
Overview:
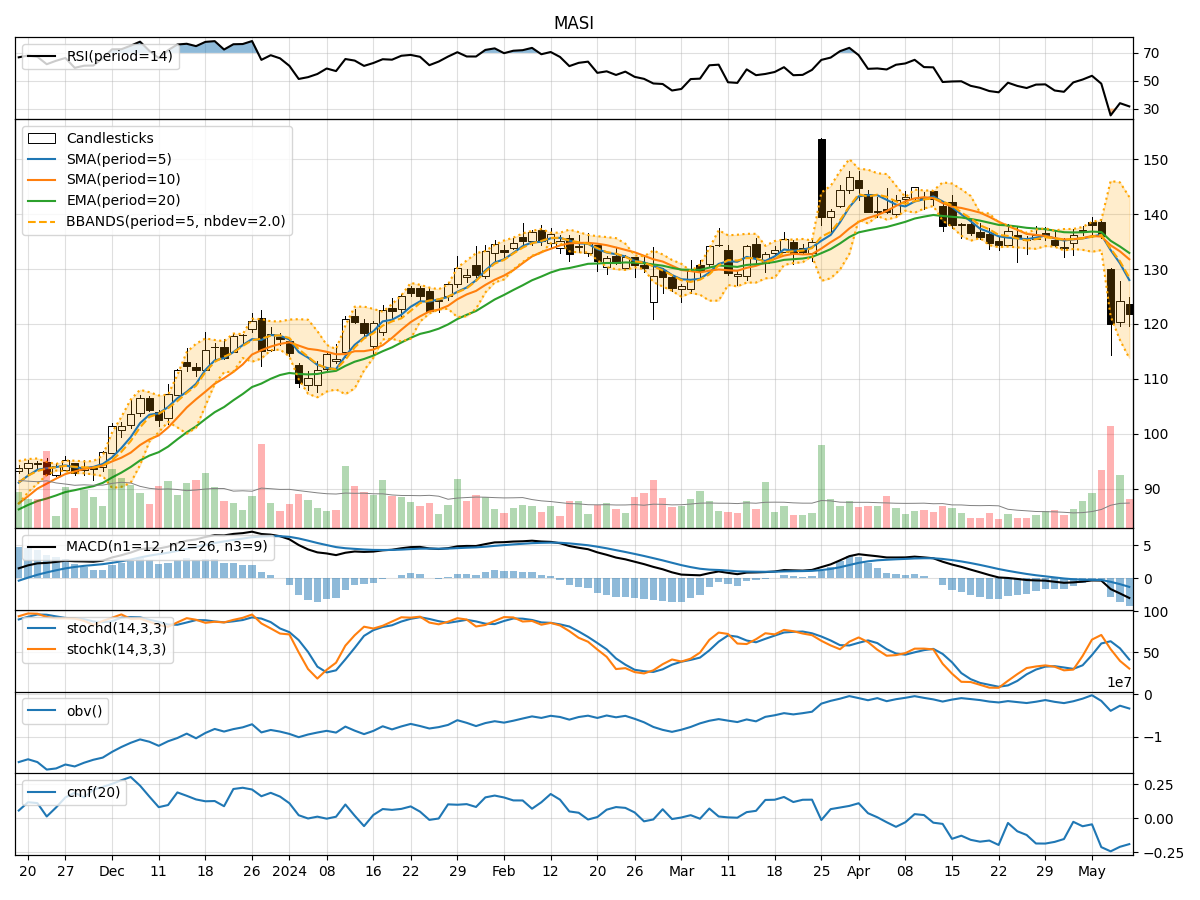
In analyzing the technical indicators for MASI over the last 5 days, we will delve into the trend, momentum, volatility, and volume indicators to provide a comprehensive outlook on the possible stock price movement in the coming days.
Trend Analysis:
- Moving Averages (MA): The 5-day Moving Average (MA) has been consistently decreasing, indicating a downward trend in the stock price.
- MACD: The Moving Average Convergence Divergence (MACD) is also negative and decreasing, signaling a bearish momentum in the stock.
- EMA: The Exponential Moving Average (EMA) is trending downwards, further supporting the bearish sentiment in the stock.
Momentum Analysis:
- RSI: The Relative Strength Index (RSI) is below 50, suggesting a bearish momentum in the stock.
- Stochastic Oscillator: Both %K and %D are trending downwards, indicating a bearish sentiment.
- Williams %R: The Williams %R is in the oversold territory, signaling a potential reversal or continuation of the downtrend.
Volatility Analysis:
- Bollinger Bands: The Bollinger Bands are widening, indicating increased volatility in the stock price.
- Bollinger %B: The %B is below 0.2, suggesting that the stock is oversold and may see a potential bounce back.
Volume Analysis:
- On-Balance Volume (OBV): The OBV is decreasing, indicating that selling pressure is higher than buying pressure.
- Chaikin Money Flow (CMF): The CMF is negative, suggesting a bearish sentiment in the stock.
Key Observations:
- The stock is currently in a downtrend based on the moving averages and MACD.
- Momentum indicators such as RSI and Stochastic Oscillator support the bearish sentiment.
- Volatility is increasing, which may lead to sharp price movements in the coming days.
- The volume indicators reflect higher selling pressure compared to buying pressure.
Conclusion:
Based on the analysis of the technical indicators, the next few days' possible stock price movement for MASI is likely to be downward. The stock is currently in a bearish trend, supported by momentum indicators and volume analysis. Traders and investors should exercise caution and consider short-term selling or wait for a potential reversal confirmation before considering long positions.