Technical Analysis of MAT 2024-05-10
Overview:
In analyzing the technical indicators for MAT over the last 5 days, we will delve into the trend, momentum, volatility, and volume indicators to provide a comprehensive outlook on the possible stock price movement in the coming days. By examining these key aspects, we aim to offer valuable insights and predictions to guide your investment decisions.
Trend Indicators:
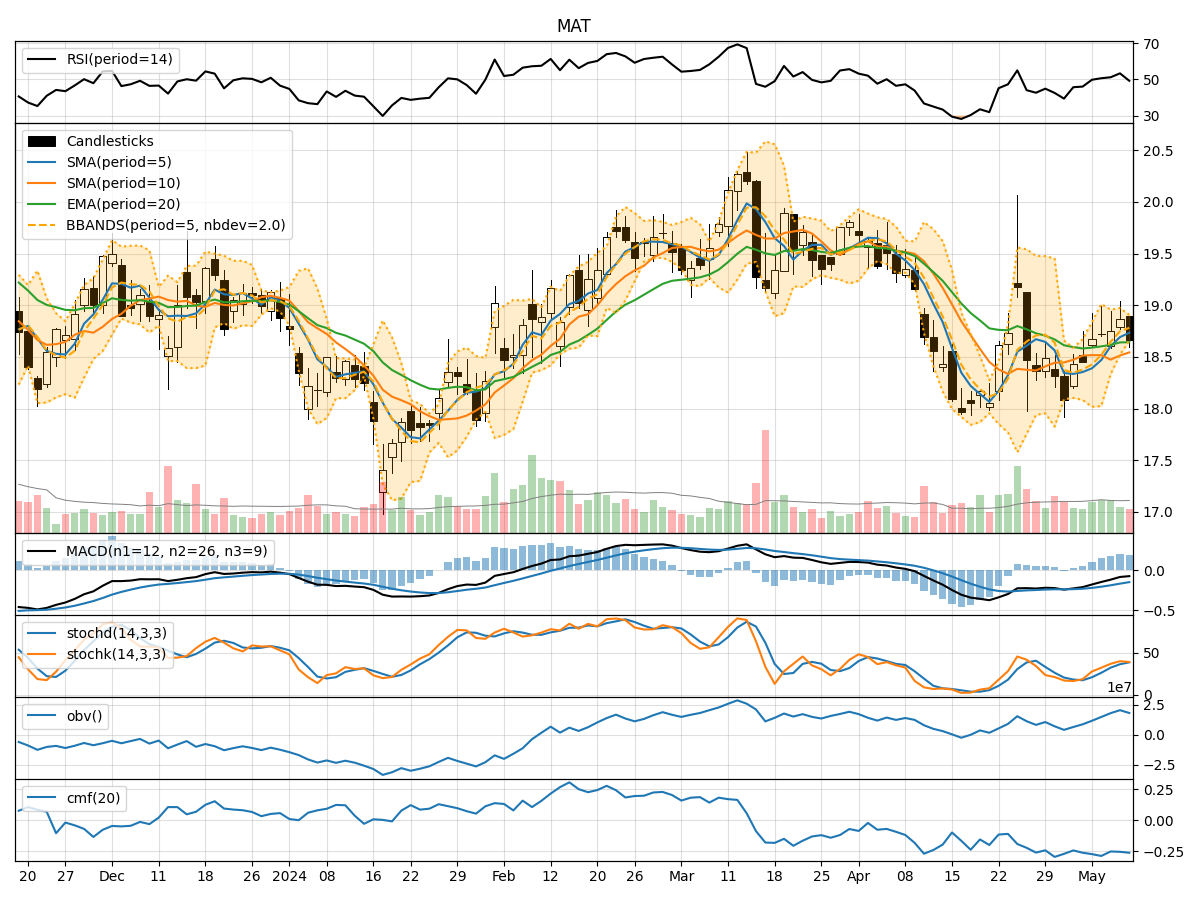
- Moving Averages (MA): The 5-day moving average has been fluctuating around the closing prices, indicating short-term price trends. The Simple Moving Average (SMA) and Exponential Moving Average (EMA) show a slight upward trend.
- MACD: The MACD line has been negative, but the MACD Histogram is showing signs of convergence towards the signal line, suggesting a potential reversal.
- Conclusion: The trend indicators suggest a neutral to slightly bullish outlook for MAT in the near term.
Momentum Indicators:
- RSI: The Relative Strength Index has been hovering around the mid-level, indicating a balanced momentum between buying and selling pressure.
- Stochastic Oscillator: Both %K and %D have been fluctuating, but not in overbought or oversold territory.
- Conclusion: Momentum indicators imply a sideways movement with no clear bias towards either bullish or bearish momentum.
Volatility Indicators:
- Bollinger Bands: The stock price has been trading within the bands, with the %B indicator showing price nearing the lower band.
- Conclusion: Volatility indicators suggest a potential increase in volatility as the price approaches the lower Bollinger Band.
Volume Indicators:
- On-Balance Volume (OBV): The OBV has been fluctuating, indicating mixed buying and selling pressure.
- Chaikin Money Flow (CMF): The CMF has been negative, suggesting outflow of money from the stock.
- Conclusion: Volume indicators reflect mixed sentiment with no clear direction in terms of accumulation or distribution.
Overall Conclusion:
Based on the analysis of trend, momentum, volatility, and volume indicators, the overall outlook for MAT in the next few days appears to be neutral with a slight bullish bias. While trend indicators show a potential for a bullish reversal, momentum and volume indicators suggest a lack of strong buying or selling pressure. Volatility indicators hint at a possible increase in price fluctuations.
Recommendation:
Considering the mixed signals from the technical indicators, it is advisable to exercise caution and closely monitor the price action of MAT in the coming days. Traders may consider waiting for more clarity in the market direction before making significant trading decisions. Long-term investors could use this period of consolidation to reassess their positions and wait for a clearer trend to emerge.
Disclaimer:
Remember that technical analysis is not a guaranteed predictor of future price movements, and other fundamental factors can influence stock prices. It is essential to conduct thorough research and consider multiple indicators before making any investment decisions. Consulting with a financial advisor can provide personalized insights tailored to your specific investment goals and risk tolerance level.