Technical Analysis of MDLZ 2024-05-10
Overview:
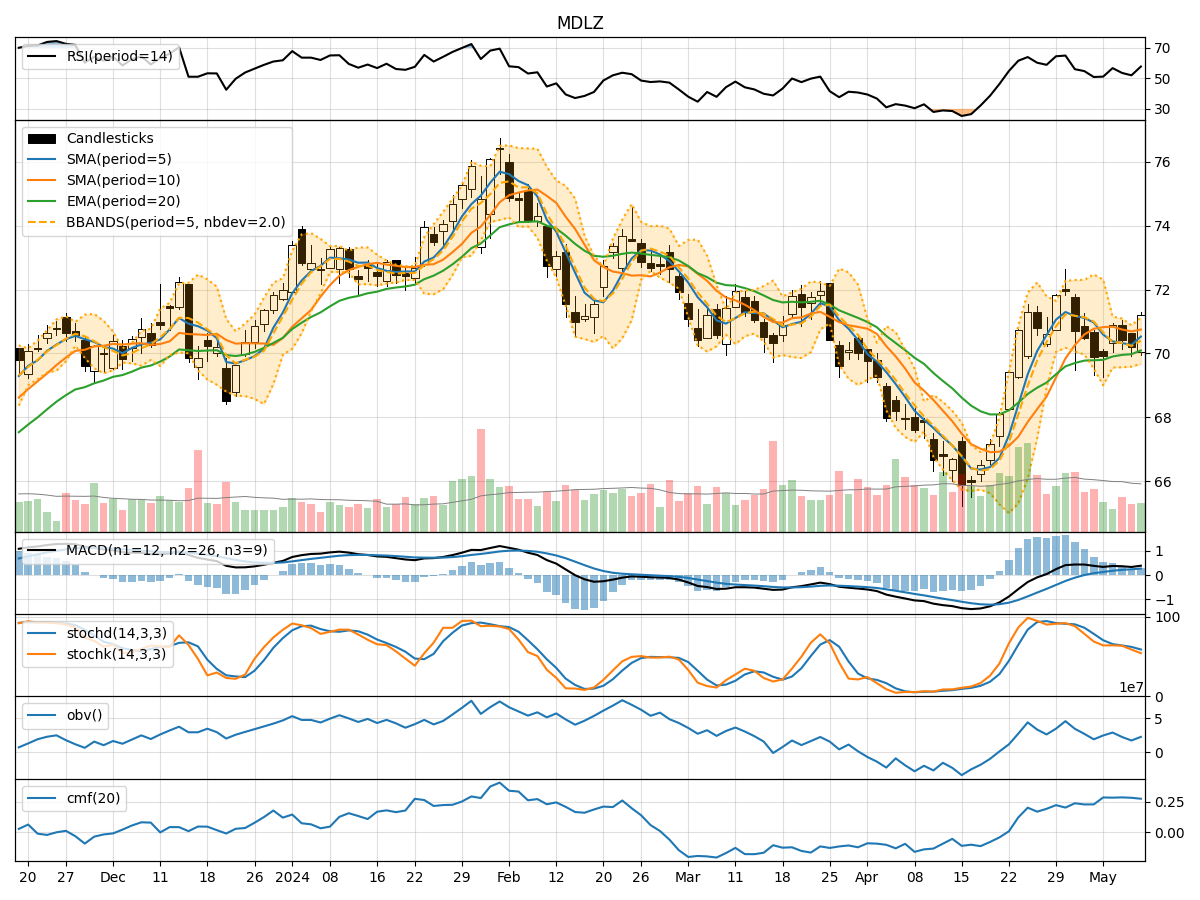
In analyzing the technical indicators for MDLZ over the last 5 days, we will delve into the trend, momentum, volatility, and volume indicators to provide a comprehensive outlook on the possible stock price movement in the coming days. By examining these key indicators, we aim to offer valuable insights and predictions for potential investors.
Trend Analysis:
- Moving Averages (MA): The 5-day MA has been fluctuating around the stock price, indicating short-term price trends. The SMA(10) and EMA(20) have shown a slight convergence, suggesting a potential shift in momentum.
- MACD: The MACD line has been positive, indicating a bullish trend, with the MACD histogram showing an increasing trend over the last few days.
Momentum Analysis:
- RSI: The RSI has been hovering around the neutral zone, indicating a balanced momentum in the stock.
- Stochastic Oscillator: Both %K and %D have been declining, suggesting a potential weakening of the bullish momentum.
- Williams %R: The Williams %R has been fluctuating in the oversold territory, indicating a possible reversal in the short term.
Volatility Analysis:
- Bollinger Bands: The stock price has been trading within the Bollinger Bands, with the bands narrowing, indicating a potential decrease in volatility.
- Bollinger %B: The %B indicator has been fluctuating around the midline, suggesting a balanced volatility level.
Volume Analysis:
- On-Balance Volume (OBV): The OBV has been negative, indicating a net selling pressure in the stock.
- Chaikin Money Flow (CMF): The CMF has been relatively stable, indicating a neutral money flow in the stock.
Key Observations:
- The trend indicators suggest a potential shift in momentum with the convergence of moving averages.
- Momentum indicators show a mixed signal with RSI in the neutral zone and stochastic indicators hinting at a weakening bullish momentum.
- Volatility indicators point towards a decrease in volatility, potentially leading to a consolidation phase.
- Volume indicators indicate a net selling pressure in the stock, which could impact future price movements.
Conclusion:
Based on the analysis of the technical indicators, the stock price of MDLZ is likely to experience a sideways movement in the coming days. The convergence of moving averages and the decrease in volatility suggest a period of consolidation. However, the net selling pressure indicated by volume indicators may put downward pressure on the stock price. Investors should exercise caution and closely monitor the price action for any potential breakout or reversal signals.