Technical Analysis of MDXH 2024-05-10
Overview:
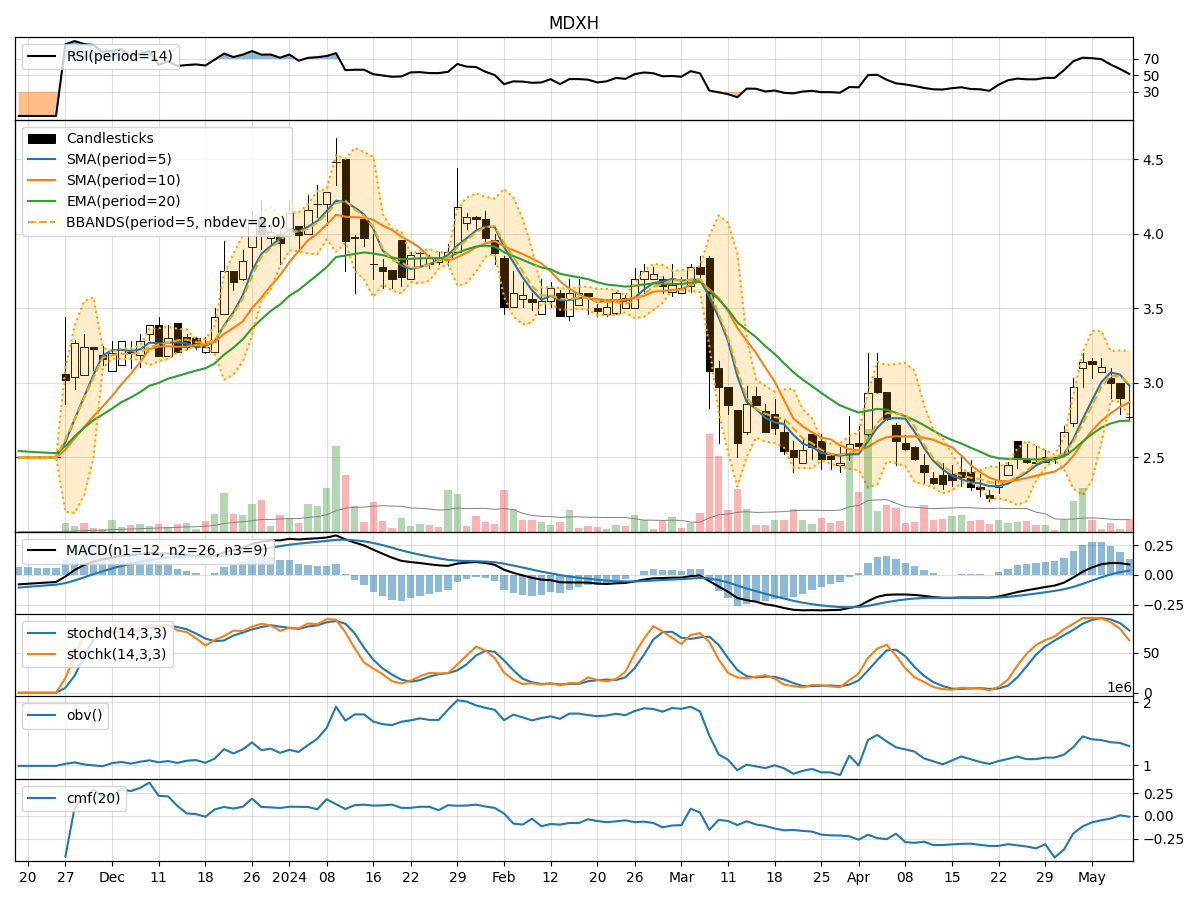
In the last 5 trading days, MDXH stock has shown a downward trend in price, accompanied by decreasing volume. The trend indicators suggest a weakening trend, with the moving averages and MACD showing a bearish signal. Momentum indicators also indicate a loss of strength in the stock's price movement. Volatility indicators show a narrowing of the Bollinger Bands, indicating decreasing price fluctuations. Volume indicators reflect a negative trend in the On-Balance Volume (OBV) and Chaikin Money Flow (CMF).
Trend Indicators Analysis:
- Moving averages (MA) have been declining, indicating a downward trend in the stock price.
- MACD and MACD Histogram (MACDH) are both in negative territory, signaling a bearish momentum.
- The stock is below the Exponential Moving Average (EMA), suggesting a bearish sentiment.
Momentum Indicators Analysis:
- Relative Strength Index (RSI) has been decreasing, indicating weakening momentum.
- Stochastic Oscillator shows the stock is in oversold territory, suggesting a potential reversal.
- Williams %R (Willams %R) is in the oversold region, indicating a possible buying opportunity.
Volatility Indicators Analysis:
- Bollinger Bands are narrowing, indicating decreasing volatility and a potential consolidation phase.
- Bollinger Band Percentage (BBP) is low, suggesting a period of low volatility.
Volume Indicators Analysis:
- On-Balance Volume (OBV) has been declining, indicating selling pressure.
- Chaikin Money Flow (CMF) is negative, suggesting a bearish sentiment in the stock.
Conclusion:
Based on the technical indicators and analysis: - Trend: The stock is in a downtrend based on moving averages and MACD. - Momentum: Momentum indicators suggest a weakening momentum in the stock price. - Volatility: Volatility indicators point towards a consolidation phase with decreasing price fluctuations. - Volume: Volume indicators reflect selling pressure in the stock.
Forecast:
Considering the overall analysis, the next few days' possible stock price movement for MDXH is likely to continue in a downward direction. Traders and investors should exercise caution and consider waiting for a more favorable entry point before considering any long positions. It is advisable to monitor key support levels and wait for signs of a potential reversal before considering any bullish positions.