Technical Analysis of MHUA 2024-05-10
Overview:
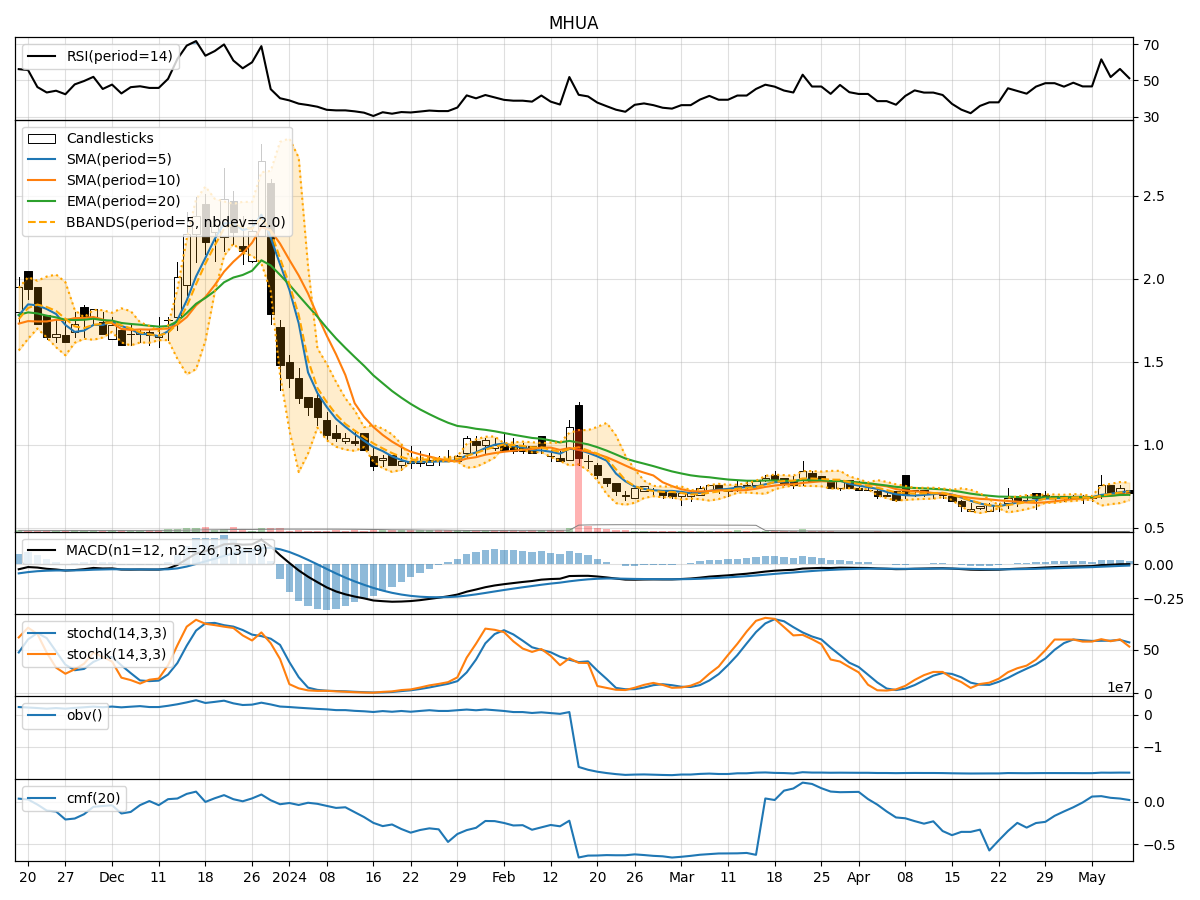
In analyzing the technical indicators for MHUA stock over the last 5 days, we will delve into the trends, momentum, volatility, and volume aspects to provide a comprehensive outlook on the possible stock price movement in the coming days. By examining key indicators such as moving averages, MACD, RSI, Bollinger Bands, and OBV, we aim to offer valuable insights and predictions for informed decision-making.
Trend Analysis:
- Moving Averages (MA): The 5-day MA has been fluctuating around the stock price, indicating short-term price trends.
- MACD: The MACD line has been consistently below the signal line, suggesting a bearish momentum.
- EMA: The EMA shows a slight upward trend, but the overall momentum remains weak.
Momentum Analysis:
- RSI: The RSI values have been oscillating around the midline, indicating a lack of strong momentum in either direction.
- Stochastic Oscillator: Both %K and %D values have been relatively neutral, reflecting a balanced market sentiment.
- Williams %R: The Williams %R values have been hovering in the oversold territory, suggesting a potential reversal.
Volatility Analysis:
- Bollinger Bands: The bands have been narrowing, indicating decreasing volatility and a possible consolidation phase.
- Bollinger %B: The %B values have been fluctuating within a moderate range, reflecting stability in price movements.
Volume Analysis:
- On-Balance Volume (OBV): The OBV values have been slightly declining, signaling a decrease in buying pressure.
- Chaikin Money Flow (CMF): The CMF values have been relatively low, indicating a lack of strong buying or selling pressure.
Conclusion:
Based on the analysis of the technical indicators, the stock is likely to experience sideways movement in the coming days. The lack of strong trends in the moving averages, neutral momentum indicators, decreasing volatility, and subdued volume signals suggest a period of consolidation. Traders may expect the stock price to trade within a narrow range without significant upward or downward movements. It is advisable to exercise caution and wait for clearer signals before making trading decisions.