Technical Analysis of MLKN 2024-05-10
Overview:
In analyzing the technical indicators for MLKN stock over the last 5 days, we will delve into the trend, momentum, volatility, and volume indicators to provide a comprehensive outlook on the possible stock price movement in the coming days. By examining these key aspects, we aim to offer valuable insights and recommendations for potential investors.
Trend Indicators:
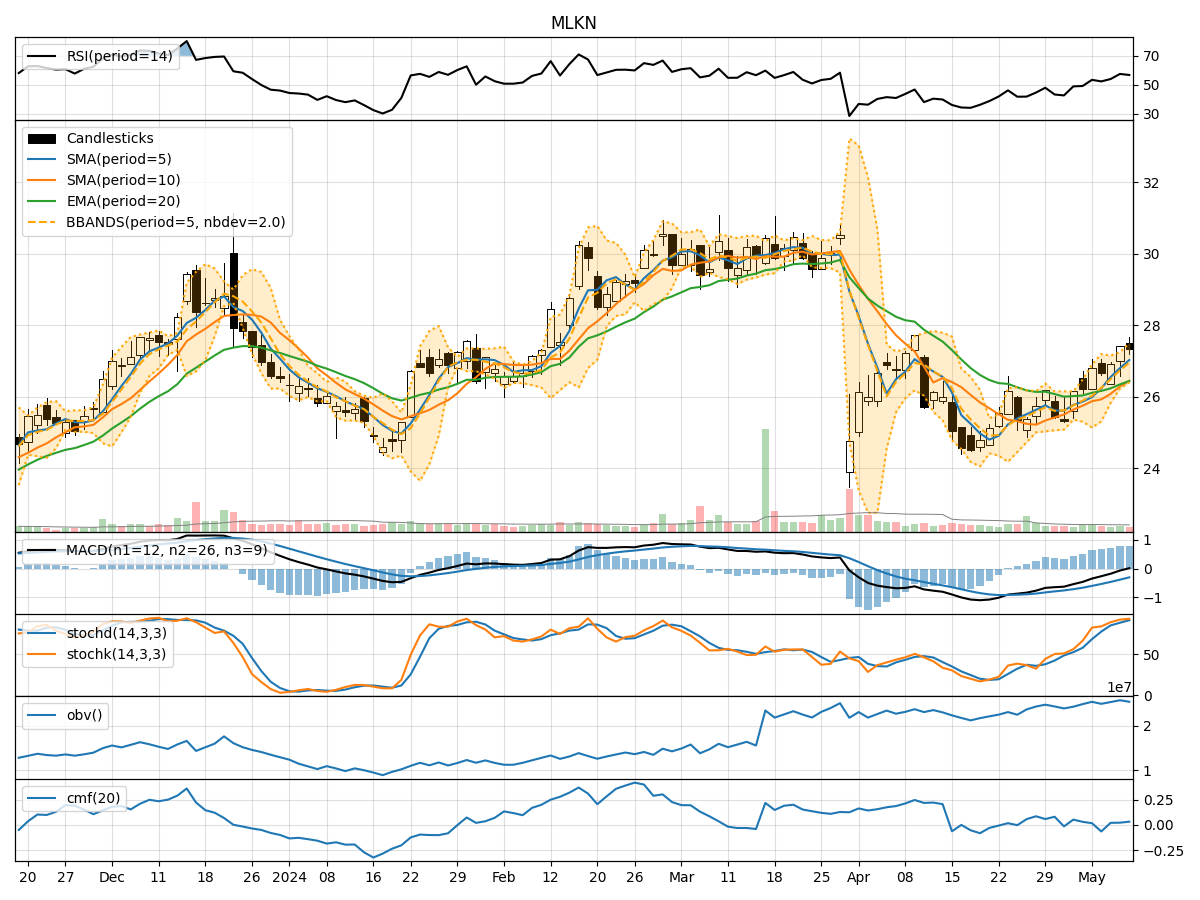
- Moving Averages (MA): The 5-day moving average has been steadily increasing, indicating a positive trend in the stock price.
- MACD: The MACD line has been consistently above the signal line, suggesting bullish momentum.
- RSI: The Relative Strength Index has been fluctuating around the 50 level, indicating a neutral stance in terms of momentum.
Momentum Indicators:
- Stochastic Oscillator: Both %K and %D have been in the overbought territory, signaling a potential reversal or consolidation.
- RSI: The RSI has been hovering around the neutral zone, reflecting indecision in the market sentiment.
Volatility Indicators:
- Bollinger Bands: The stock price has been trading within the bands, indicating a period of consolidation.
- Average True Range (ATR): The ATR has been relatively stable, suggesting consistent volatility levels.
Volume Indicators:
- On-Balance Volume (OBV): The OBV has shown a slight increase, indicating accumulation by investors.
- Chaikin Money Flow (CMF): The CMF has been positive, suggesting buying pressure in the stock.
Key Observations:
- The trend indicators point towards a bullish sentiment with the moving averages and MACD signaling upward momentum.
- Momentum indicators show mixed signals with the stochastic oscillator in the overbought region and RSI indicating neutrality.
- Volatility indicators suggest a period of consolidation with the stock price trading within the Bollinger Bands.
- Volume indicators reflect a slight increase in buying pressure as seen in OBV and CMF.
Conclusion:
Based on the analysis of the technical indicators, the stock price of MLKN is likely to experience a period of consolidation in the coming days. The bullish trend indicated by moving averages and MACD may face resistance due to overbought conditions in the stochastic oscillator. Investors should exercise caution and monitor for potential reversal signals before considering entry or exit positions.