Technical Analysis of MLTX 2024-05-10
Overview:
In analyzing the technical indicators for MLTX over the last 5 days, we will delve into the trend, momentum, volatility, and volume indicators to provide a comprehensive outlook on the possible stock price movement in the coming days. By examining these key aspects, we aim to offer valuable insights and predictions to guide investment decisions.
Trend Analysis:
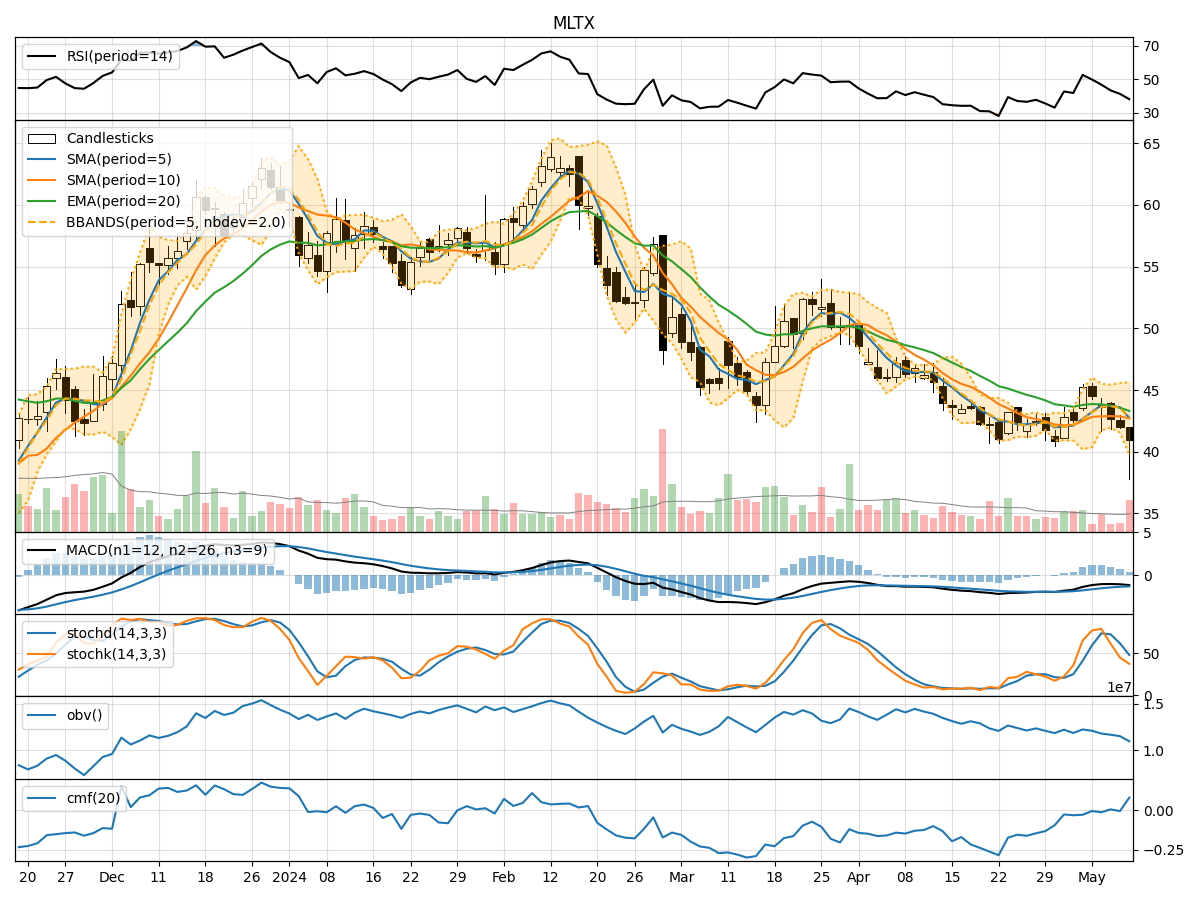
- Moving Averages (MA): The 5-day Moving Average (MA) has been declining steadily, indicating a bearish trend in the short term.
- MACD: The Moving Average Convergence Divergence (MACD) has been consistently negative, suggesting downward momentum.
- EMA: The Exponential Moving Average (EMA) has also been trending downwards, reinforcing the bearish sentiment.
Momentum Analysis:
- RSI: The Relative Strength Index (RSI) has been decreasing, indicating weakening momentum.
- Stochastic Oscillator: Both %K and %D of the Stochastic Oscillator have been declining, signaling a bearish momentum.
- Williams %R: The Williams %R is in oversold territory, suggesting a potential reversal or continuation of the downtrend.
Volatility Analysis:
- Bollinger Bands: The Bollinger Bands have been narrowing, indicating decreasing volatility.
- Bollinger %B: The %B indicator is low, suggesting a potential oversold condition.
Volume Analysis:
- On-Balance Volume (OBV): The OBV has been decreasing, indicating selling pressure.
- Chaikin Money Flow (CMF): The CMF has been negative, reflecting outflow of money from the stock.
Key Observations and Opinions:
- Trend: The trend indicators point towards a clear downward trend in the stock price.
- Momentum: Momentum indicators confirm the bearish sentiment with weakening momentum.
- Volatility: Volatility has been decreasing, potentially signaling a period of consolidation or sideways movement.
- Volume: The declining OBV and negative CMF suggest bearish volume trends.
Conclusion:
Based on the analysis of the technical indicators, the next few days for MLTX are likely to see a continuation of the downward trend in the stock price. The momentum indicators support the bearish outlook, while decreasing volatility may lead to a period of consolidation. The volume indicators also indicate ongoing selling pressure. Therefore, the overall outlook for MLTX in the coming days is bearish, with a potential for further downside movement. Investors should exercise caution and consider risk management strategies in their decision-making process.