Technical Analysis of MNDO 2024-05-10
Overview:
In analyzing the technical indicators for MNDO over the last 5 days, we will delve into the trend, momentum, volatility, and volume indicators to provide a comprehensive outlook on the possible stock price movement. By examining these key factors, we aim to offer valuable insights and predictions for the upcoming days.
Trend Analysis:
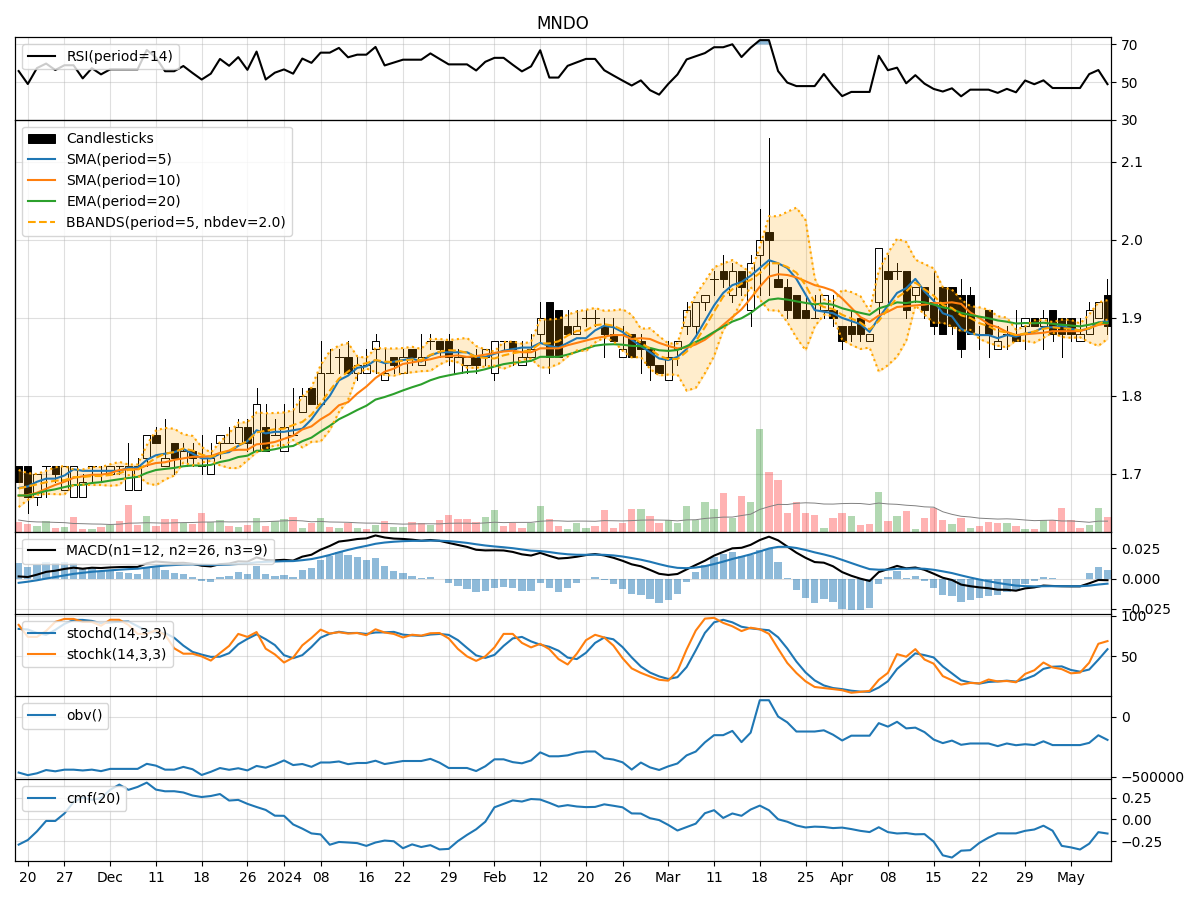
- Moving Averages (MA): The 5-day Moving Average (MA) has been fluctuating around the current stock price, indicating a lack of clear trend direction.
- MACD and Signal Line: The MACD has been hovering around the signal line, suggesting a neutral momentum in the short term.
- EMA: The Exponential Moving Average (EMA) has shown slight fluctuations but has not provided a strong indication of a clear trend direction.
Key Observation: The trend indicators suggest a lack of strong trend direction, with the stock price moving within a narrow range.
Momentum Analysis:
- RSI: The Relative Strength Index (RSI) has been fluctuating around the mid-level, indicating a balanced momentum between buying and selling pressure.
- Stochastic Oscillator: The Stochastic Oscillator has shown mixed signals, with occasional overbought and oversold conditions.
- Williams %R: The Williams %R has also oscillated between overbought and oversold levels.
Key Observation: Momentum indicators reflect a neutral stance with no clear bias towards either bullish or bearish momentum.
Volatility Analysis:
- Bollinger Bands: The Bollinger Bands have shown narrowing volatility, suggesting a potential decrease in price fluctuations.
- Bollinger %B: The Bollinger %B has remained within a moderate range, indicating stability in price movements.
Key Observation: Volatility indicators point towards a consolidation phase with reduced price volatility.
Volume Analysis:
- On-Balance Volume (OBV): The OBV has shown mixed volume accumulation and distribution signals, indicating indecision among market participants.
- Chaikin Money Flow (CMF): The CMF has been negative, suggesting a slight outflow of money from the stock.
Key Observation: Volume indicators suggest a lack of strong conviction among investors, leading to mixed signals in volume accumulation.
Conclusion:
Based on the analysis of trend, momentum, volatility, and volume indicators, the stock price of MNDO is likely to experience sideways movement in the upcoming days. The lack of clear trend direction, neutral momentum, reduced volatility, and mixed volume signals indicate a period of consolidation and indecision in the market.
Recommendation: It is advisable for investors to exercise caution and closely monitor key technical levels for potential breakout or breakdown scenarios. Consider waiting for clearer signals or confirmation of a new trend before making significant trading decisions.
Overall Sentiment: Neutral/Sideways movement expected in the near term for MNDO.