Technical Analysis of MRCY 2024-05-10
Overview:
In analyzing the technical indicators for MRCY over the last 5 days, we will delve into the trend, momentum, volatility, and volume indicators to provide a comprehensive assessment of the stock's potential price movement. By examining these key factors, we aim to offer valuable insights and predictions for the next few days.
Trend Analysis:
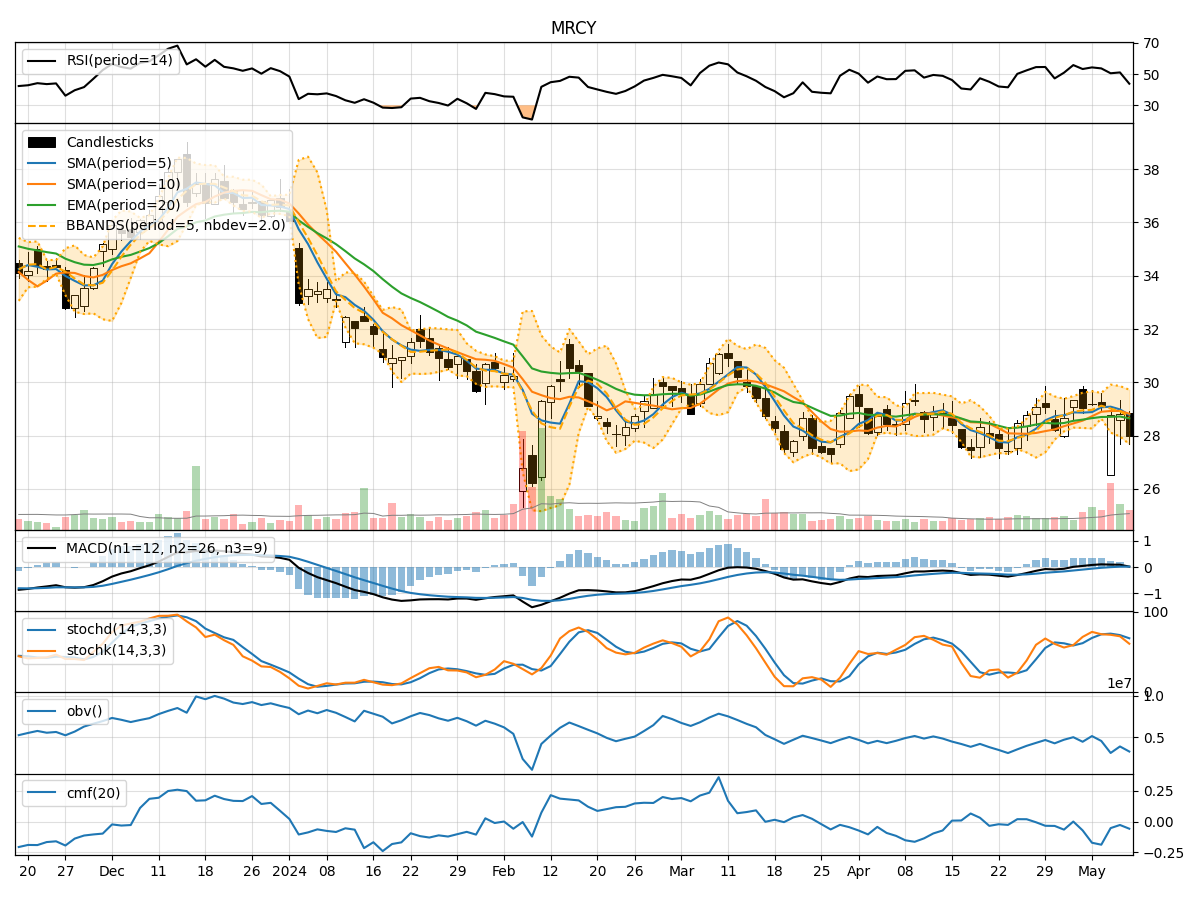
- Moving Averages (MA): The 5-day Moving Average (MA) has been fluctuating around the $28.80-$29.10 range, indicating a relatively stable trend in the short term.
- MACD: The Moving Average Convergence Divergence (MACD) has shown slight positive momentum, with the MACD line crossing above the signal line on some days, suggesting a potential bullish signal.
- EMA: The Exponential Moving Average (EMA) has been relatively flat, indicating a lack of strong directional bias in the longer term.
Key Observation: The trend indicators suggest a neutral to slightly bullish sentiment in the short term.
Momentum Analysis:
- RSI: The Relative Strength Index (RSI) has been hovering around the mid-range (50), indicating a balanced momentum between buying and selling pressure.
- Stochastic Oscillator: Both %K and %D lines of the Stochastic Oscillator have been declining, signaling a potential weakening of momentum.
- Williams %R: The Williams %R is in oversold territory, suggesting a possible reversal or bounce in the near future.
Key Observation: Momentum indicators point towards a neutral to slightly bearish outlook in the short term.
Volatility Analysis:
- Bollinger Bands: The Bollinger Bands have shown narrowing width, indicating decreasing volatility and a potential period of consolidation.
- Bollinger %B: The %B indicator has been relatively low, suggesting the stock is trading near the lower band of the Bollinger Bands.
- Average True Range (ATR): ATR has decreased, indicating a decline in price volatility.
Key Observation: Volatility indicators signal a period of consolidation and decreased price fluctuations.
Volume Analysis:
- On-Balance Volume (OBV): The OBV has shown mixed movements, indicating indecision among market participants.
- Chaikin Money Flow (CMF): The CMF has been negative, suggesting outflow of money from the stock.
Key Observation: Volume indicators reflect uncertainty and a lack of strong buying or selling pressure.
Conclusion:
Based on the analysis of trend, momentum, volatility, and volume indicators, the stock price of MRCY is likely to experience sideways movement in the next few days. The trend indicators show a neutral to slightly bullish sentiment, while momentum indicators lean towards a neutral to slightly bearish outlook. Volatility indicators point towards a period of consolidation, and volume indicators indicate indecision among market participants.
Overall Assessment: The stock is expected to trade within a narrow range with no clear directional bias. Traders may consider range-bound strategies until a stronger trend emerges.