Technical Analysis of MRNO 2024-05-31
Overview:
In analyzing the technical indicators for MRNO over the last 5 days, we will delve into the trend, momentum, volatility, and volume indicators to provide a comprehensive outlook on the possible stock price movement in the coming days. By examining these key aspects, we aim to offer valuable insights and predictions for potential investors.
Trend Indicators:
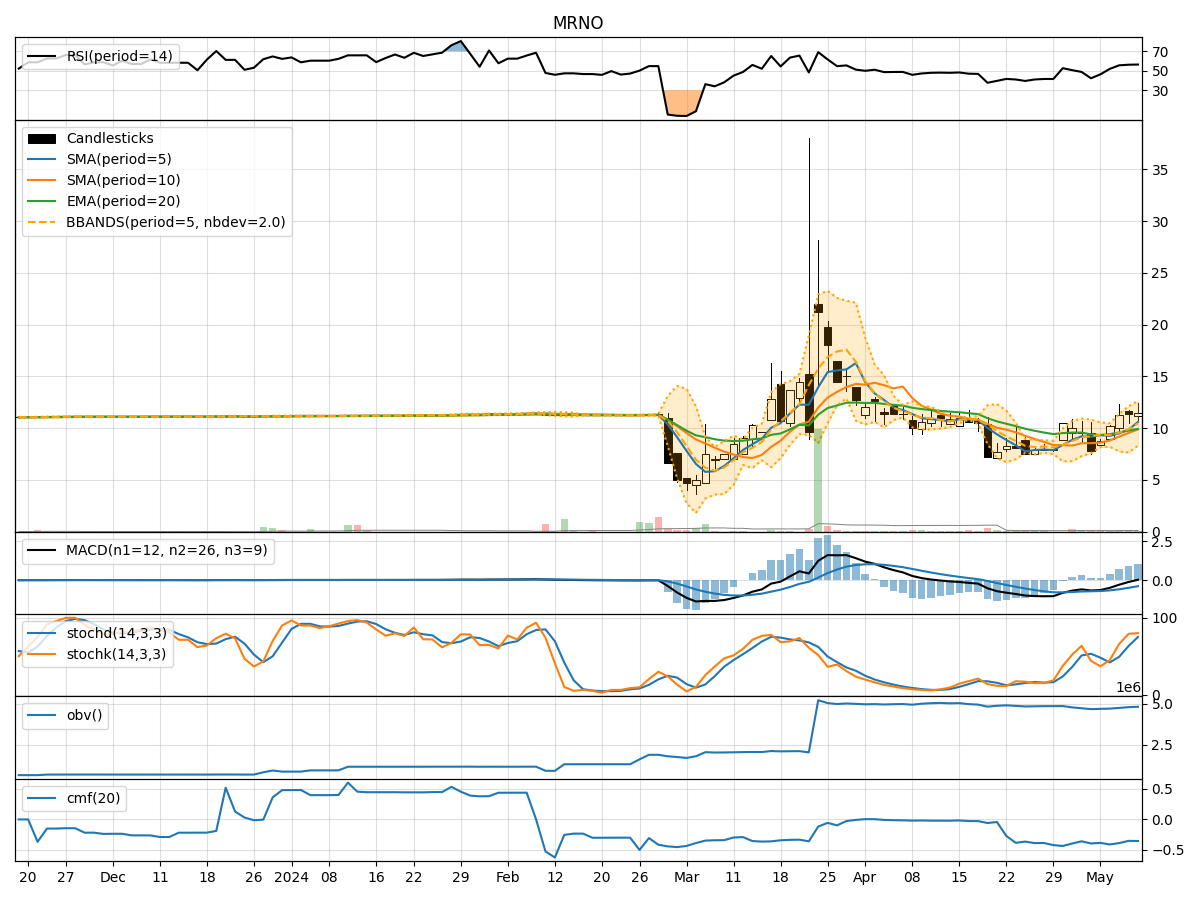
- Moving Averages (MA): The 5-day MA has been consistently below the closing prices, indicating a downward trend.
- MACD: The MACD line has been positive but decreasing, while the MACD Histogram has been negative, suggesting a potential reversal.
- EMA: The EMA has been fluctuating but has not shown a clear trend direction.
Momentum Indicators:
- RSI: The RSI has been oscillating around the 50 level, indicating indecision in the market.
- Stochastic Oscillator: Both %K and %D have been moving erratically, reflecting uncertainty in momentum.
- Williams %R: The indicator has been in oversold territory, signaling a potential reversal.
Volatility Indicators:
- Bollinger Bands (BB): The bands have been narrowing, indicating decreasing volatility.
- BB %B: The %B has been fluctuating within a range, suggesting uncertainty in price direction.
Volume Indicators:
- On-Balance Volume (OBV): The OBV has shown mixed signals, with no clear trend in volume accumulation.
- Chaikin Money Flow (CMF): The CMF has been positive but relatively flat, indicating a neutral stance on money flow.
Key Observations and Opinions:
- Trend: The trend indicators suggest a lack of clear direction, with conflicting signals from moving averages and MACD.
- Momentum: Momentum indicators reflect indecision and potential for a reversal, as seen in RSI and Williams %R.
- Volatility: Volatility has been decreasing, which could precede a period of consolidation or a breakout.
- Volume: Volume indicators do not provide a strong indication of market sentiment, with mixed signals from OBV and CMF.
Conclusion:
Based on the analysis of the technical indicators, the stock of MRNO is currently in a sideways consolidation phase with uncertain momentum and low volatility. The lack of clear trends in the trend and volume indicators, coupled with mixed signals in momentum indicators, suggests that the stock price may continue to trade within a range in the near term. Investors should exercise caution and wait for more definitive signals before making trading decisions.