Technical Analysis of MRTN 2024-05-31
Overview:
In analyzing the technical indicators for MRTN over the last 5 days, we will delve into the trend, momentum, volatility, and volume indicators to provide a comprehensive outlook on the possible stock price movement in the coming days. By examining these key aspects, we aim to offer valuable insights and predictions for informed decision-making.
Trend Indicators:
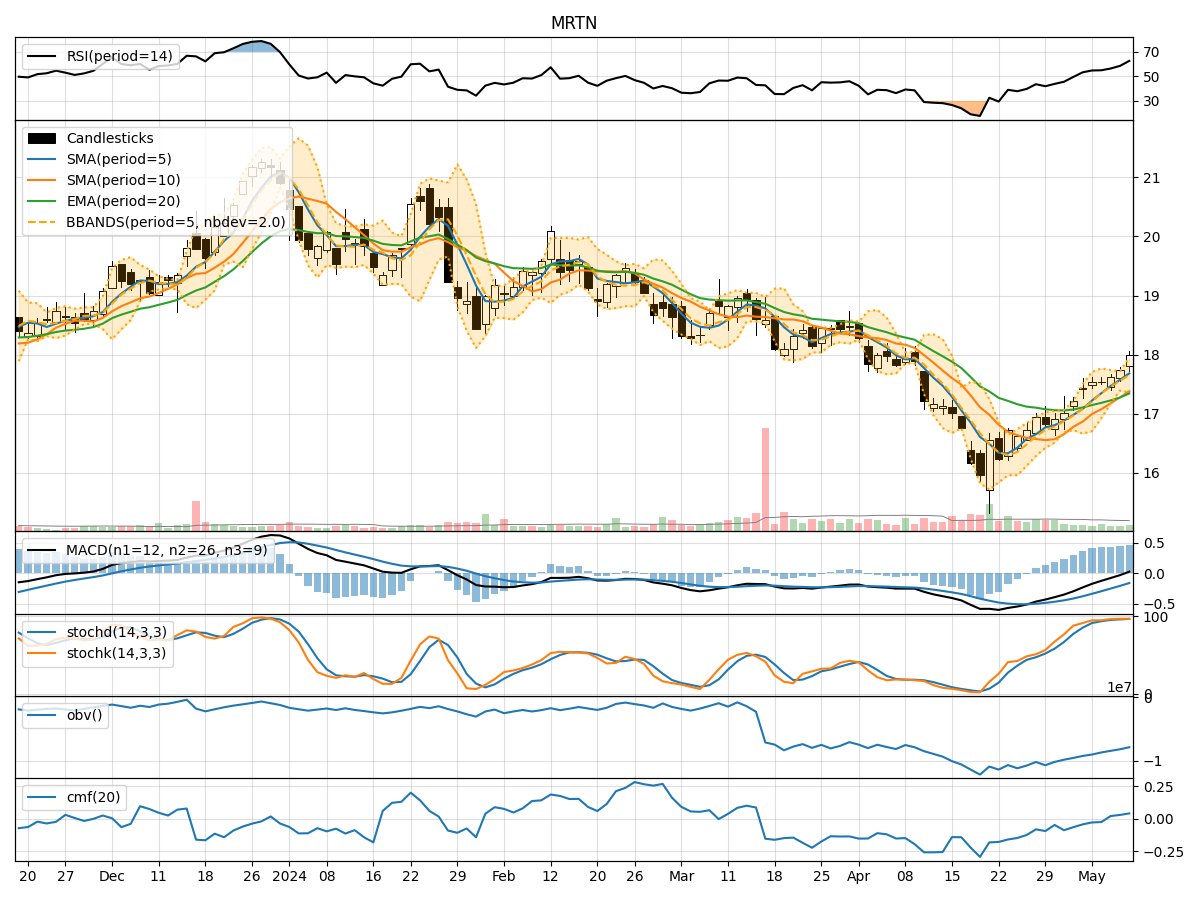
- Moving Averages (MA): The 5-day MA has been consistently below the closing prices, indicating a short-term downtrend.
- MACD: The MACD line has been positive but decreasing, while the MACD Histogram has been consistently negative, suggesting a weakening bullish momentum.
- EMA: The EMA has been declining, reflecting a bearish sentiment in the short to medium term.
Momentum Indicators:
- RSI: The RSI has been fluctuating around the 50 level, indicating a lack of strong momentum in either direction.
- Stochastic Oscillator: Both %K and %D have been in oversold territory, signaling a potential reversal or consolidation phase.
- Williams %R: The indicator has been in oversold territory, suggesting a possible buying opportunity.
Volatility Indicators:
- Bollinger Bands (BB): The bands have been narrowing, indicating decreasing volatility and a potential breakout or significant price movement ahead.
- BB %B: The %B indicator has been fluctuating within a narrow range, reflecting a period of consolidation.
Volume Indicators:
- On-Balance Volume (OBV): The OBV has been declining, suggesting selling pressure in the market.
- Chaikin Money Flow (CMF): The CMF has been close to zero, indicating a balance between buying and selling pressure.
Key Observations:
- The trend indicators suggest a bearish sentiment in the short term, with weakening bullish momentum.
- Momentum indicators show a lack of strong directional bias, indicating a potential period of consolidation or reversal.
- Volatility indicators point towards a potential breakout or significant price movement.
- Volume indicators reflect selling pressure and a balance between buying and selling activity.
Conclusion:
Based on the analysis of the technical indicators, the stock price of MRTN is likely to experience further downside movement in the near term. The indicators collectively suggest a bearish outlook with potential for increased volatility and a possible breakout. Traders and investors should exercise caution and consider risk management strategies in light of the current market dynamics.