Technical Analysis of MSBI 2024-05-10
Overview:
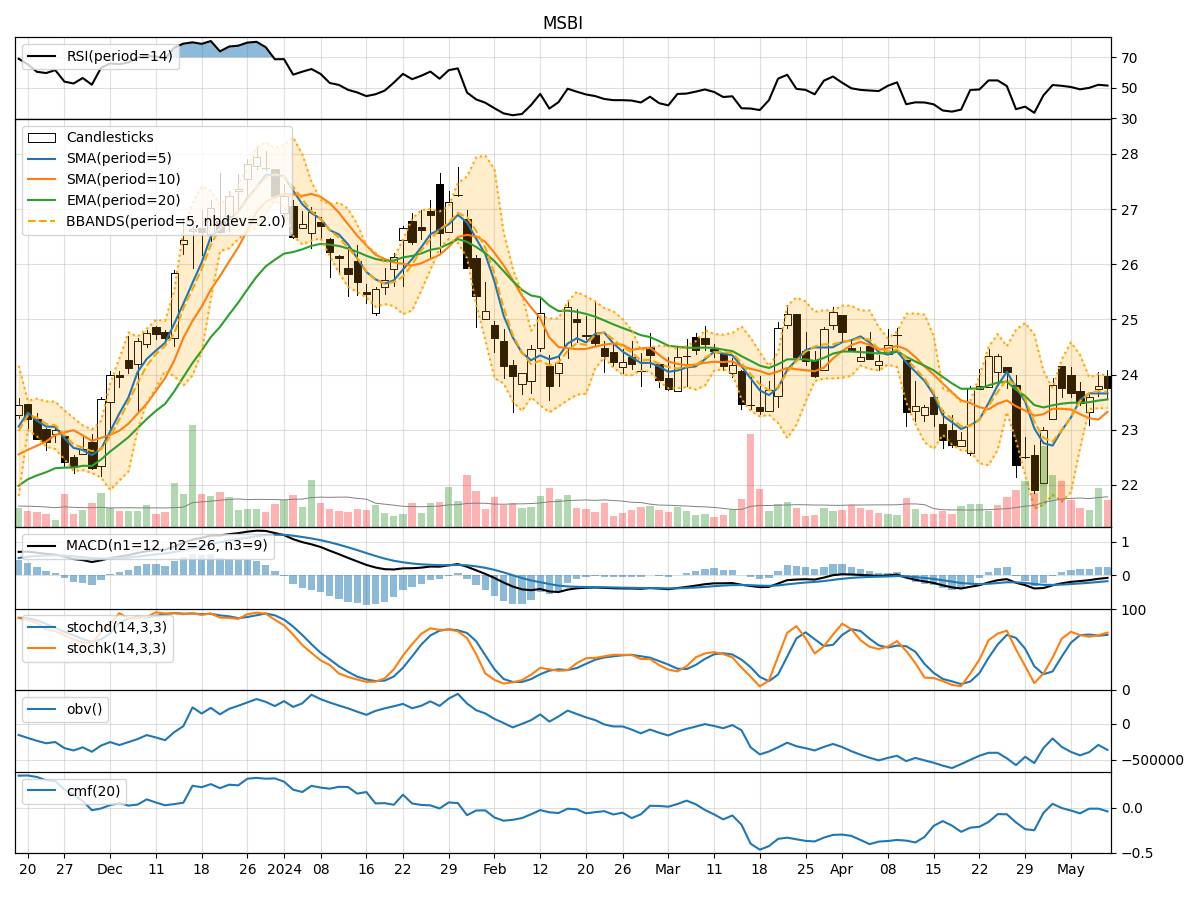
In the last 5 trading days, MSBI stock has shown mixed signals across various technical indicators. The stock price has been fluctuating within a narrow range, indicating indecision in the market. We will analyze the trend, momentum, volatility, and volume indicators to provide insights into the possible future stock price movement.
Trend Indicators:
- Moving averages (MA) show a slight uptrend, with the 5-day MA consistently above the 10-day simple moving average (SMA).
- Exponential moving average (EMA) has been relatively flat, suggesting a lack of strong trend direction.
- Moving Average Convergence Divergence (MACD) is negative but showing signs of convergence, indicating a potential shift in momentum.
Momentum Indicators:
- Relative Strength Index (RSI) is hovering around the neutral zone, indicating a balanced momentum between buying and selling pressure.
- Stochastic oscillators show mixed signals, with %K above %D but both in overbought territory.
- Williams %R is also in the oversold region, suggesting a possible reversal in the short term.
Volatility Indicators:
- Bollinger Bands are narrowing, indicating decreasing volatility and a potential breakout in the near future.
- Bollinger Band Percentage (BBP) is low, suggesting a period of consolidation or sideways movement.
Volume Indicators:
- On-Balance Volume (OBV) has been fluctuating, indicating uncertainty in the accumulation/distribution of the stock.
- Chaikin Money Flow (CMF) is negative, reflecting selling pressure in the market.
Key Observations:
- The stock is currently in a consolidation phase with no clear trend direction.
- Momentum indicators suggest a lack of strong buying or selling pressure.
- Volatility is decreasing, indicating a potential period of price stability.
- Volume indicators show mixed signals, reflecting indecision among market participants.
Conclusion:
Based on the analysis of technical indicators, the stock is likely to continue trading sideways in the near term. Traders should exercise caution and wait for a clearer trend to emerge before making significant trading decisions. It is advisable to monitor key support and resistance levels for potential breakout opportunities. Overall, the market sentiment for MSBI stock appears neutral with a bias towards consolidation.